
Overview
The MACD Histogram Dynamic Threshold Breakout Quantitative Trading Strategy is an enhanced momentum trading strategy based on the classic MACD technical indicator. This strategy captures strong momentum signals in the market through specific threshold triggering mechanisms, enabling bidirectional trading operations. The strategy employs an asymmetric threshold design with a long signal trigger threshold of +2.5 and a short signal trigger threshold of -2.0, reflecting the asymmetric characteristics of market upward and downward momentum.
Strategy Principles
The core principle of this strategy is based on momentum analysis of the MACD histogram. First, the strategy calculates the MACD indicator using custom parameters: fast EMA period of 48, slow EMA period of 104, and signal EMA period of 9. These parameter settings are smoother compared to traditional MACD indicators (12,26,9), effectively filtering short-term noise and capturing more stable trend signals.
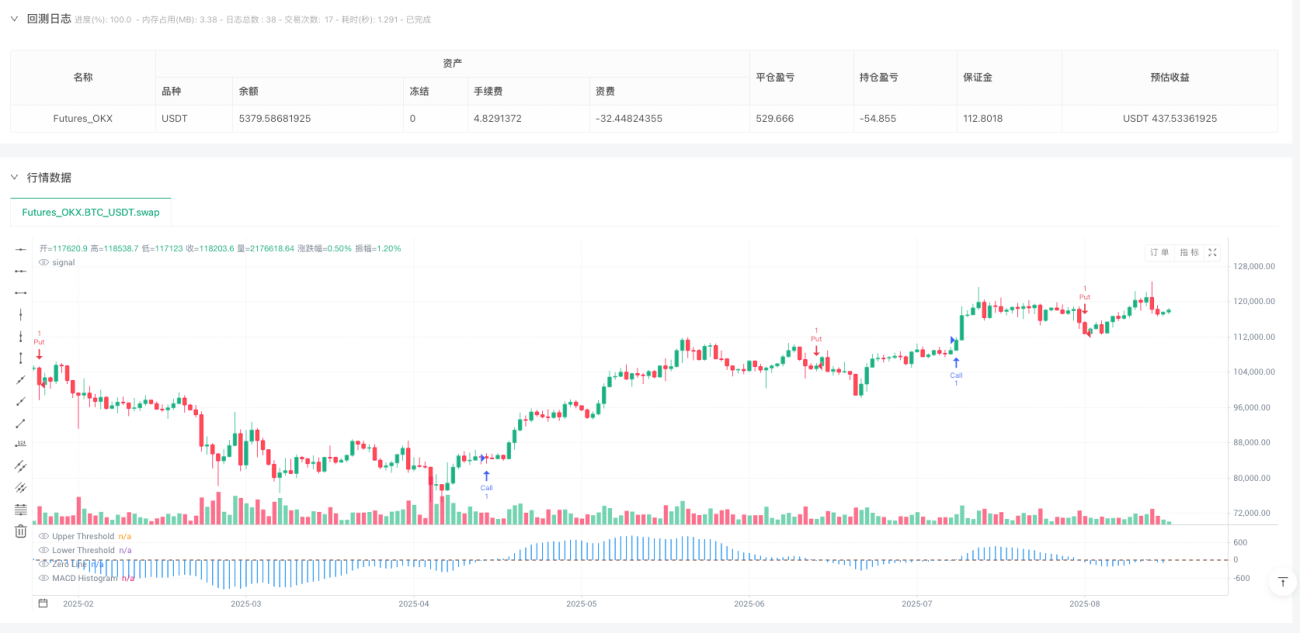
The MACD histogram calculation formula is: Histogram = MACD Line - Signal Line. When the histogram value exceeds +2.5, it indicates strong bullish momentum, triggering a long signal; when the histogram value falls below -2.0, it indicates strong bearish momentum, triggering a short signal. The strategy uses a state machine mechanism to manage trading signals through two boolean variables, waitForLong and waitForShort, to track threshold breakthrough states, ensuring signal validity and continuity.
The trade execution mechanism adopts a confirmation-before-execution approach. When the histogram first reaches the threshold, a waiting state is set, and trades are executed after the next candlestick close confirms the signal. This design effectively avoids risks from false breakouts.
Strategy Advantages
This strategy possesses multiple technical advantages. First, the asymmetric threshold design aligns with actual market characteristics. Considering the "slow rise, fast fall" nature of stock markets, setting different trigger thresholds for long and short operations improves signal adaptability and accuracy.
Second, parameter optimization significantly enhances strategy performance. By adjusting the fast line period from the traditional 12 to 48 and the slow line period from 26 to 104, the strategy better adapts to medium to long-term trends, reducing interference from short-term market noise and improving signal quality.
The strategy's state management mechanism ensures trading logic rigor. By introducing a waiting confirmation mechanism, the strategy avoids multiple invalid signals generated during repeated oscillations at threshold boundaries, improving trading efficiency.
Bidirectional trading capability enables the strategy to capture profit opportunities in different market environments, achieving profitability through corresponding long and short operations in both bull and bear markets.
The clear and intuitive visualization design, through histogram display and threshold line markers, allows traders to intuitively observe the strategy's operational status and signal generation.
Strategy Risks
Despite its numerous advantages, this strategy still has potential risks that require focused attention.
The primary risk is frequent trading in oscillating markets. When markets are in sideways consolidation, the MACD histogram may repeatedly fluctuate around thresholds, generating excessive trading signals, leading to increased trading costs and reduced capital efficiency. It's recommended to mitigate this issue by adding additional trend confirmation indicators or extending confirmation periods.
Lag is a common deficiency of all moving average-based strategies. Since MACD is essentially a lagging indicator based on EMA calculations, strategy signals often appear after price changes, potentially missing optimal entry timing. Consider combining leading indicators like RSI or stochastic oscillators to identify trend reversal points earlier.
The subjectivity of threshold settings is also an important risk factor. The current +2.5 and -2.0 thresholds are set based on historical data and experience, which may require adjustment in different market environments or for different instruments. Comprehensive backtesting and parameter optimization are recommended to find the most suitable threshold settings for specific markets.
Single indicator dependency risk cannot be ignored. The strategy relies entirely on the MACD histogram for decision-making, lacking multiple confirmation mechanisms, which may produce misleading signals under special market conditions.
Strategy Optimization Directions
Based on in-depth code analysis, this strategy has several important optimization directions worth exploring.
First, implementing a dynamic threshold adjustment mechanism is recommended. Thresholds can be dynamically adjusted based on market volatility, appropriately raising thresholds in high volatility environments and lowering them in low volatility environments. This better adapts to different market conditions and improves signal effectiveness.
Second, introducing multi-timeframe analysis will significantly enhance strategy performance. Major trend direction can be confirmed on longer timeframes, then specific entry opportunities can be sought on shorter timeframes. This approach reduces the risk of counter-trend trading.
Perfecting stop-loss and take-profit mechanisms is another important optimization direction. The current strategy lacks clear risk management rules. It's recommended to set dynamic stop-loss levels based on ATR indicators and implement staged take-profit strategies to maximize returns while controlling risks.
Adding filter conditions will also help improve strategy quality. Consider incorporating volume confirmation, price breakthrough of key support/resistance levels, or RSI divergence confirmation to reduce false signal generation.
Finally, adaptive parameter optimization is a cutting-edge research direction. Through machine learning algorithms, MACD parameters and threshold settings can be dynamically adjusted, enabling the strategy to self-adapt to different market environments.
Summary
The MACD Histogram Dynamic Threshold Breakout Quantitative Trading Strategy is a well-structured, logically clear momentum trading strategy. By improving traditional MACD indicator parameter settings and introducing asymmetric threshold mechanisms, it effectively enhances signal quality and market adaptability. The strategy's bidirectional trading capability and rigorous state management mechanism provide a solid foundation for practical application.
However, as a single-indicator strategy, it still has limitations such as strong lag and poor performance in oscillating markets. By introducing dynamic threshold adjustment, multi-timeframe analysis, comprehensive risk management mechanisms, and multiple confirmation conditions, this strategy has the potential to significantly improve performance while maintaining simplicity.
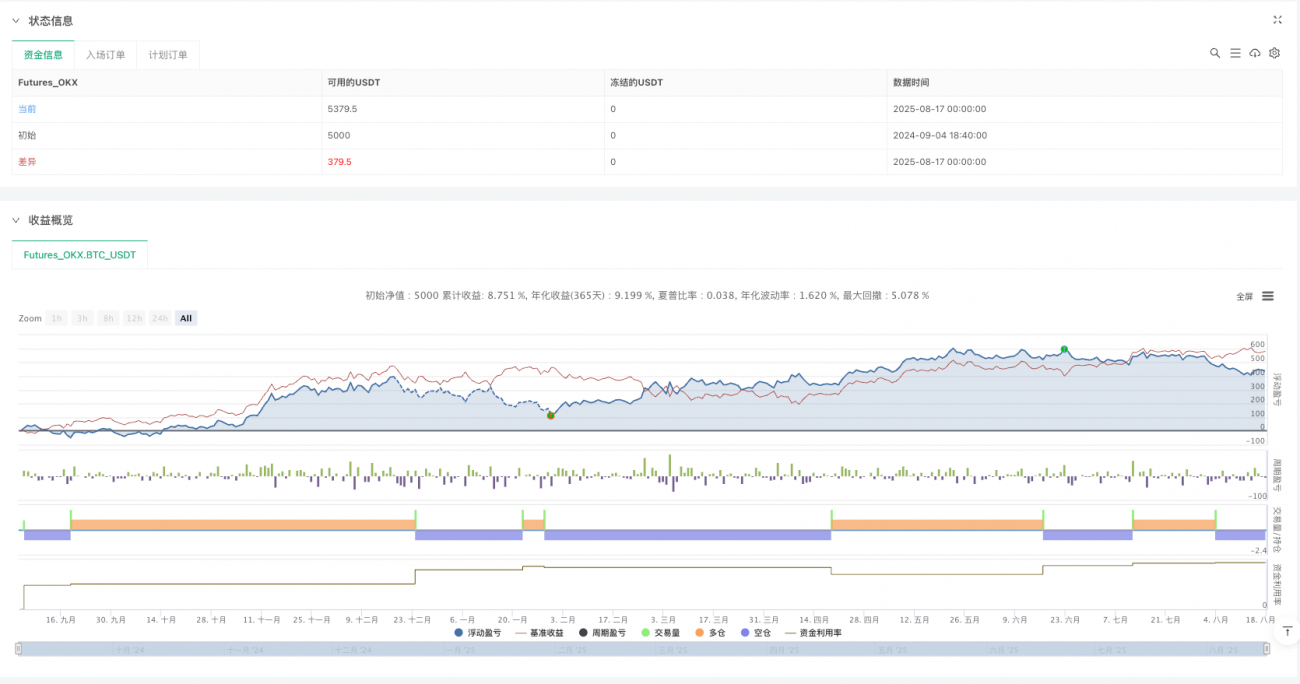
For quantitative traders, this strategy provides an excellent foundational framework that can be developed into a more robust and profitable trading system through continuous optimization and improvement. Thorough historical backtesting and prospective testing are recommended before practical application to ensure strategy effectiveness and reliability in target market environments.
- 1