Wick-to-Range Momentum EMA Filtered Trading System

Overview
The Wick-to-Range Momentum EMA Filtered Trading System is a quantitative trading strategy that combines price action analysis with technical indicators. This strategy primarily relies on candlestick wick ratios to identify potential price reversal points, enhanced by an EMA filter and trading session restrictions to optimize entry timing. The core concept is to capture momentum changes indicated by significant candlestick wicks, which often signal shifts in market sentiment and potential trading opportunities. The system specifically focuses on candles with wick proportions exceeding a preset threshold (default 45%) and generates buy or sell signals based on market position and trend direction.
Strategy Principles
The strategy operates based on the synergy of several key components:
-
Wick Ratio Analysis: The strategy calculates the proportion of upper and lower wicks relative to the total range of each candle. When the upper wick (wick_top) or lower wick (wick_bot) ratio exceeds the set threshold (default 0.45 or 45%), it's considered a potential signal.
-
EMA Filter: A 200-period Exponential Moving Average (EMA) serves as a trend direction filter. Price must be above the EMA for buy signals and below for sell signals, ensuring trades align with the primary trend direction.
-
Trading Session Restrictions: Optional limitation to specific trading sessions (default "0700-1100,1300-1600") to avoid less volatile or unstable market periods.
-
Entry Conditions:
- Buy Signal: Triggered when a candle closes above its open (bullish), the lower wick ratio ≥ threshold, price is above the EMA, and within the allowed trading session.
- Sell Signal: Triggered when a candle closes below its open (bearish), the upper wick ratio ≥ threshold, price is below the EMA, and within the allowed trading session.
-
Position Management: The strategy employs a fixed percentage of account equity (default 10%) for position sizing and allows only one directional position at a time (no pyramiding).
The strategy code checks signal conditions after confirming the current candle is complete, ensuring decisions are based on fully formed candle patterns, avoiding the risk of false signals from incomplete candles.
Strategy Advantages
After in-depth analysis, this strategy offers the following significant advantages:
-
Integration of Price Action and Technical Indicators: Captures price action characteristics through wick ratio analysis while using the EMA filter to confirm overall trend direction, combining both approaches to improve signal quality.
-
Adaptability to Market Reversals: Large wicks typically indicate a change in the balance of market forces or short-term overextension, allowing the strategy to effectively capture potential reversal points.
-
Flexible Parameter Settings: Adjustable wick ratio threshold, EMA period, and trading sessions enable the strategy to adapt to different market environments and trading instruments.
-
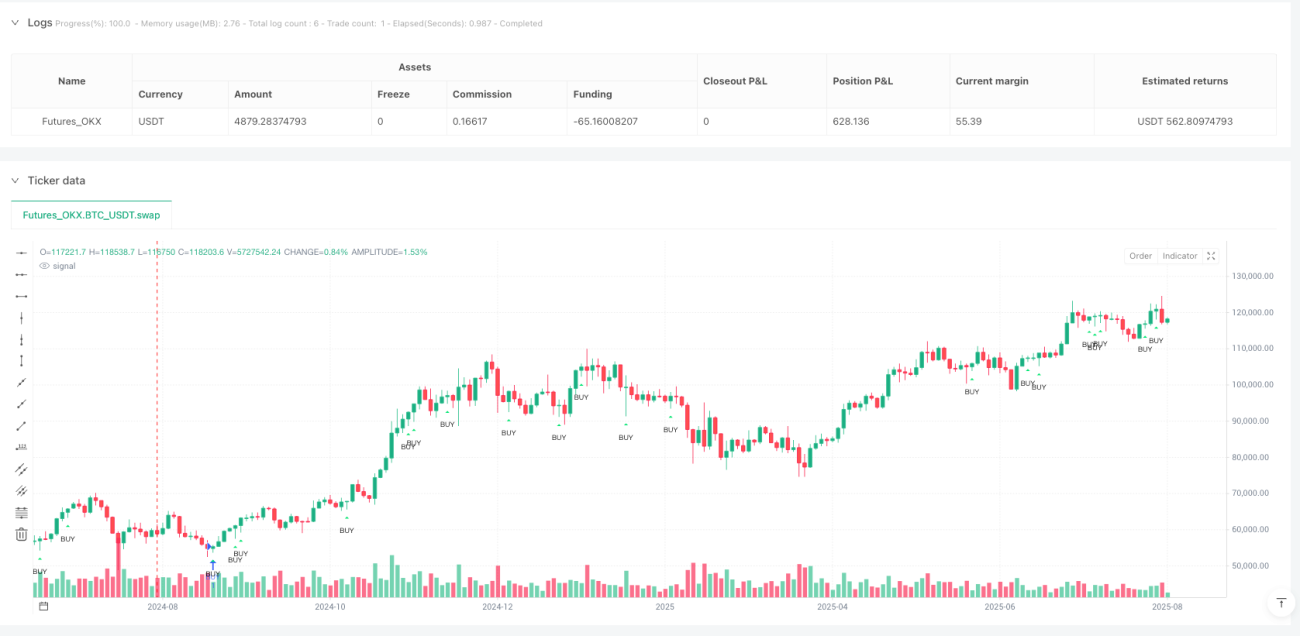
Visualization of Trading Signals: Optional entry labels and directional arrows allow traders to visually identify signals, facilitating backtesting and real-time monitoring.
-
Clear Logical Structure: Strategy rules are straightforward and intuitive, easy to understand and execute, suitable for traders of all levels.
-
Session Optimization Capability: By restricting trading sessions, the strategy can focus on the most active and effective market periods, avoiding inefficient or high-risk sessions.
-
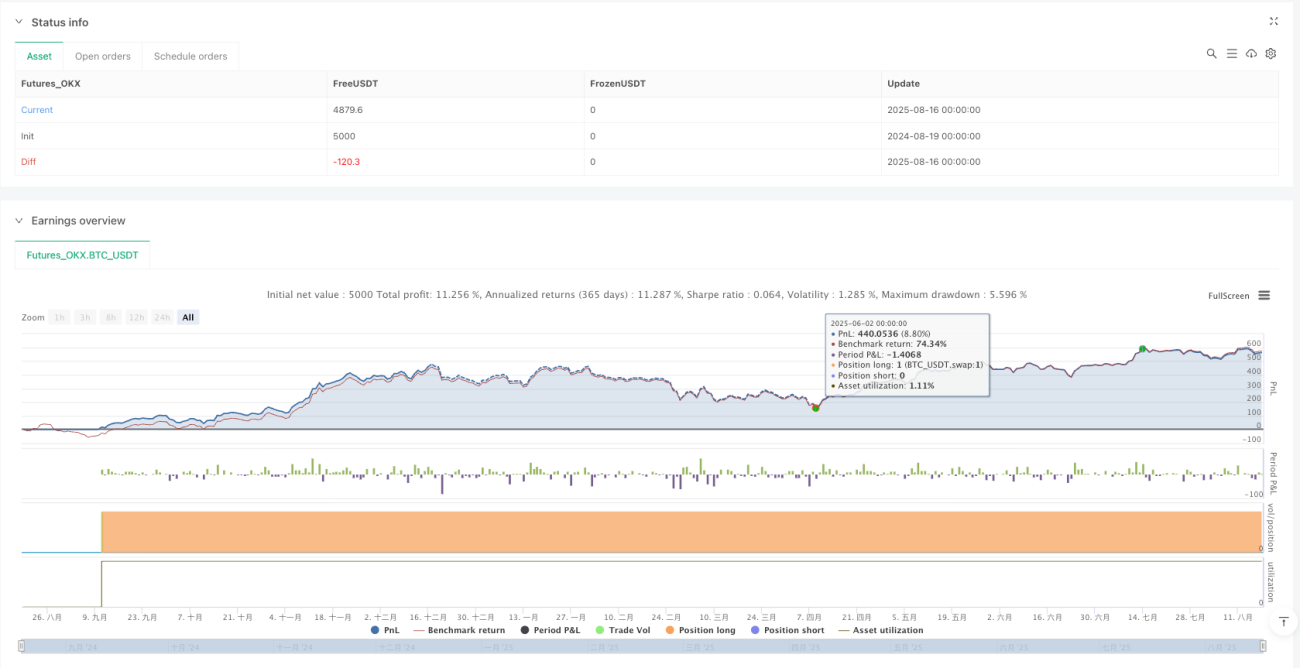
Built-in Risk Control: Using account equity percentage for position sizing automatically adjusts position size with account growth, incorporating basic risk management.
Strategy Risks
Despite its sound design, the strategy presents several potential risks:
-
Lack of Stop-Loss Mechanism: The strategy doesn't set specific stop-loss or take-profit levels, potentially leading to excessive losses during severe market fluctuations. Solution: Manually add fixed stop-loss points or dynamic stops based on ATR (Average True Range).
-
EMA Lag: As a lagging indicator, EMA may provide delayed signals in rapidly changing markets. Solution: Consider adding more sensitive short-term indicators for supplementary confirmation.
-
False Breakout Risk: Price retracements often follow large wick candles, potentially causing false signals. Solution: Add confirmation candle requirements or delay entry by one candle.
-
Market Condition Dependency: The strategy performs better in trending markets but may generate frequent false signals in ranging or highly volatile markets. Solution: Add volatility filters or market state classification mechanisms.
-
Parameter Sensitivity: The wick ratio threshold and EMA period settings significantly impact strategy performance; inappropriate parameters may lead to overtrading or missed opportunities. Solution: Optimize parameters based on historical data and periodically reassess.
-
Lack of Market Environment Adaptability: The strategy doesn't adjust parameters based on different market environments (e.g., high vs. low volatility). Solution: Develop adaptive parameter adjustment mechanisms or market environment classification systems.
-
Missed Pullback Entry Points: When price rapidly breaks through the EMA, the strategy may miss more optimal pullback entry points. Solution: Consider adding pullback detection mechanisms as auxiliary entry conditions.
Strategy Optimization Directions
Based on code analysis, the strategy can be optimized in the following directions:
-
Add Stop-Loss and Take-Profit Mechanisms: Implement dynamic stop-loss and take-profit functionality based on ATR or key price levels, setting risk-reward ratios to ensure controllable risk for each trade. This optimization is necessary because strategies without stops carry excessive risk in live trading.
-
Multi-Timeframe Confirmation: Introduce higher timeframe trend confirmation, such as checking daily trend direction to ensure alignment with short-term signals, improving overall system accuracy. Multi-timeframe analysis significantly reduces the probability of counter-trend trading.
-
Volume Confirmation: Incorporate volume as a confirmatory factor, requiring signal candles to be accompanied by significant volume changes to enhance signal quality. Volume is often a critical indicator of the intent behind price action.
-
Market Environment Classification: Develop market environment recognition mechanisms based on ATR or volatility indicators to distinguish high/low volatility environments and dynamically adjust parameters accordingly. This allows the strategy to adapt to different market states.
-
Optimize EMA Period: Test different EMA periods for adaptability to various trading instruments and timeframes, or consider using adaptive EMA. A fixed 200-period EMA may not be suitable for all markets.
-
Add Wick Confirmation Mechanism: Require consecutive wick patterns that meet conditions, or add additional pattern confirmation to reduce false signals from isolated wicks. This helps filter out low-quality signals.
-
Integrate Technical Indicators: Introduce auxiliary tools such as RSI, MACD, or stochastic oscillators for additional signal confirmation, especially looking for overbought/oversold conditions that resonate with wick signals. Multi-indicator confluence often provides more reliable signals.
-
Backtesting Optimization Framework: Develop a more comprehensive backtesting system to test strategy performance under different market environments and parameter combinations, and conduct Monte Carlo simulations to evaluate strategy robustness. Scientific backtesting is the foundation for strategy improvement.
Summary
The Wick-to-Range Momentum EMA Filtered Trading System is a quantitative strategy that combines price action analysis with technical indicators, capturing potential market reversal opportunities by identifying candle patterns with significant wick ratios and using an EMA trend filter. The strategy is straightforward and intuitive, easy to understand and execute, while offering flexible parameter settings to adapt to different market environments.
Although the strategy is well-designed, its main risk factor is the lack of a comprehensive stop-loss mechanism. Traders should consider adding appropriate risk control measures when applying the strategy in practice. Additionally, robustness and adaptability can be further enhanced through optimization measures such as multi-timeframe analysis, volume confirmation, and market environment classification.
For investors pursuing price action trading, this strategy provides a clear framework for capturing trading opportunities by focusing on subtle changes in market structure and candle patterns. With proper risk management and parameter optimization, this system has the potential to become an effective component in a trader's toolkit.
- 1