
Overview
The Tweezers Bottom Precision Reversal Detection Quantitative Strategy is a short-term trading system designed for the 5-minute timeframe, primarily focusing on capturing price reversal signals by identifying the "Tweezers Bottom" candlestick pattern. This strategy executes only long positions, automatically entering trades when it detects two consecutive candles with nearly identical lows, while setting precise stop-loss and take-profit targets. This approach is particularly suitable for rapidly fluctuating market environments, providing traders with a simple yet efficient method to capture short-term reversal opportunities.
Strategy Principles
The core principle of this strategy is based on the classic "Tweezers Bottom" candlestick pattern recognition. Analyzing the code, its operational logic is as follows:
- Defining the Tweezers Bottom pattern: When the difference between the low prices of two consecutive candles does not exceed 0.02%, the system identifies it as a valid Tweezers Bottom pattern.
- Entry signal generation: Once the Tweezers Bottom pattern is identified, the system immediately issues a long signal and displays a green upward arrow (▲) marker on the chart.
- Risk management settings: After entry, the system automatically sets the stop-loss at 0.1% below the entry price and the take-profit at 0.3% above the entry price.
- Visualization tools: The strategy dynamically displays stop-loss and take-profit lines on the chart with corresponding labels, allowing traders to visually monitor the trade status.
From the code implementation, the strategy uses a dedicated function tweezersBottom() to detect the pattern by comparing the lows of the current and previous candles to determine if they fall within the specified tolerance range. This precise mathematical calculation method enables the strategy to automatically capture potential reversal points in the market.
Strategy Advantages
-
Precise entry timing: The Tweezers Bottom pattern is a classic reversal signal that, when identified through quantitative methods, helps traders enter precisely at the early stages of reversals, capturing more potential upward movements.
-
Clear risk control: The strategy sets fixed proportional stop-loss (0.1%) and take-profit (0.3%) levels, creating a risk-reward ratio of 1:3, which is conducive to long-term stable profitability.
-
Highly visual: All signals and key price levels are clearly displayed on the chart, allowing traders to intuitively understand the logic and risk profile of each trade.
-
Adaptable to multiple markets: The strategy is applicable to various markets including forex, cryptocurrencies, and stocks, especially suitable for instruments with higher volatility.
-
Automated execution: The fully programmatic design removes emotional influence from trading decisions, improving trading discipline and consistency.
-
Simple and efficient: The strategy logic is clear and simple, easy to understand and implement, suitable for traders of different experience levels.
Strategy Risks
-
False breakout risk: The Tweezers Bottom pattern does not always lead to effective reversals and may generate misleading signals in consolidating or strong trending markets, resulting in consecutive stop-losses.
-
Tight stop-loss: The 0.1% stop-loss setting may be too tight in more volatile markets (like cryptocurrencies), easily triggered by market noise, causing unnecessary stop-outs.
-
No trend filtering: The strategy lacks a trend filtering mechanism, potentially leading to frequent counter-trend long positions during strong downtrends, increasing the risk of losses.
-
Fixed parameters: Stop-loss, take-profit, and tolerance parameters are all fixed values that cannot automatically adjust to different market conditions and volatility, reducing the strategy's adaptability.
-
Lack of trading time filtering: Without setting trading time windows, trades may be executed during periods of low market liquidity or abnormal volatility, increasing slippage and execution risks.
-
Single signal dependency: Relying solely on the Tweezers Bottom pattern without combining other technical indicators for confirmation may lead to unstable signal quality.
Strategy Optimization Directions
-
Add trend filters: Incorporate moving averages or ADX trend indicators to only open long positions in uptrends or ranging markets, avoiding counter-trend trading in downtrends.
-
Dynamic stop-loss settings: Adjust stop-loss distances based on market volatility (such as the ATR indicator) to better adapt to different market environments.
-
Introduce trading time filters: Set specific trading time windows to avoid abnormal volatility periods such as market openings, closings, and important news releases.
-
Add confirmation indicators: Combine RSI, MACD, or volume indicators as trade confirmation conditions to improve signal quality.
-
Optimize risk management: Introduce position sizing calculations to automatically adjust the size of each trade based on account size and market volatility.
-
Incorporate multiple timeframe analysis: Combine trend directions from higher timeframes (such as 15-minute or 1-hour) and only enter trades when aligned with the overall trend direction.
-
Expand to a bi-directional strategy: Add Tweezers Top short functionality to make the strategy adaptable to more market environments.
-
Implement machine learning optimization: Use historical data to train models that optimize pattern recognition parameters and stop-loss/take-profit levels to improve overall strategy performance.
Conclusion
The Tweezers Bottom Precision Reversal Detection Quantitative Strategy is a concise and practical short-term trading system that captures market reversal opportunities by identifying Tweezers Bottom patterns. Its clear risk management settings and highly visual design make it easy to use and monitor. However, to improve the strategy's robustness and adaptability, it is recommended to add trend filtering, dynamic stop-losses, and multi-indicator confirmation.
This strategy is particularly suitable for quick trading and short-term operations, serving as a valuable tool for traders looking to capture reversal opportunities on the 5-minute chart. With proper optimization and risk management, it can become an effective component of a trading system, but traders should avoid over-reliance on a single strategy and instead incorporate it as part of a more comprehensive trading plan.
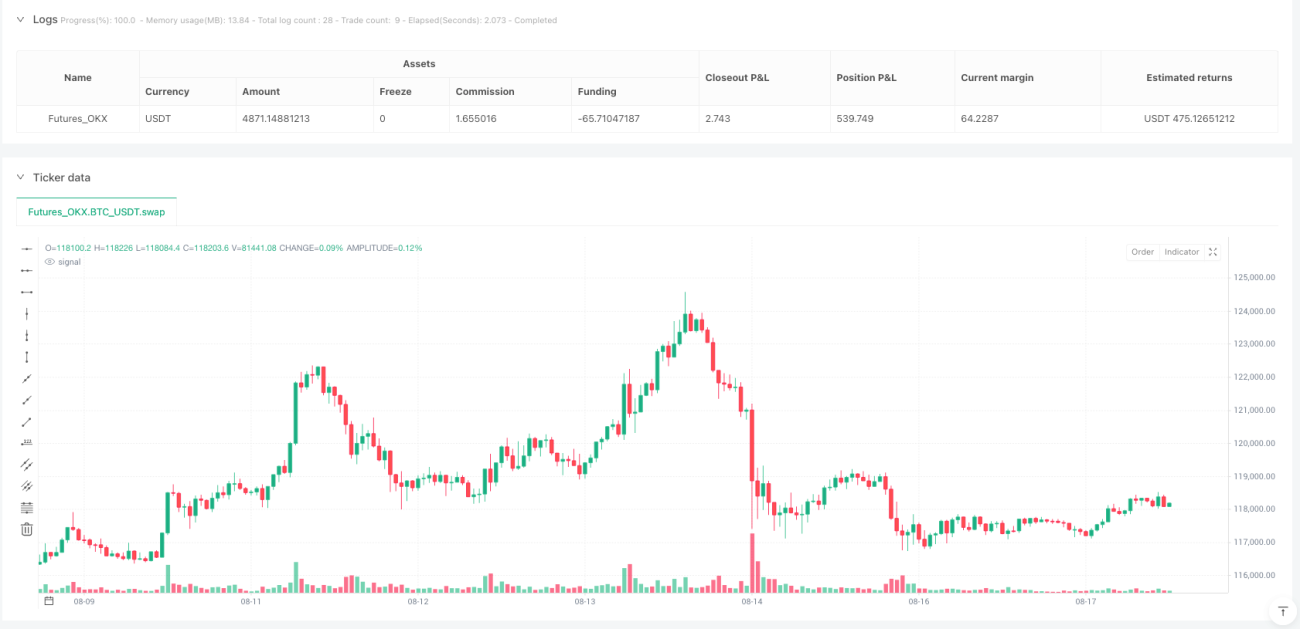
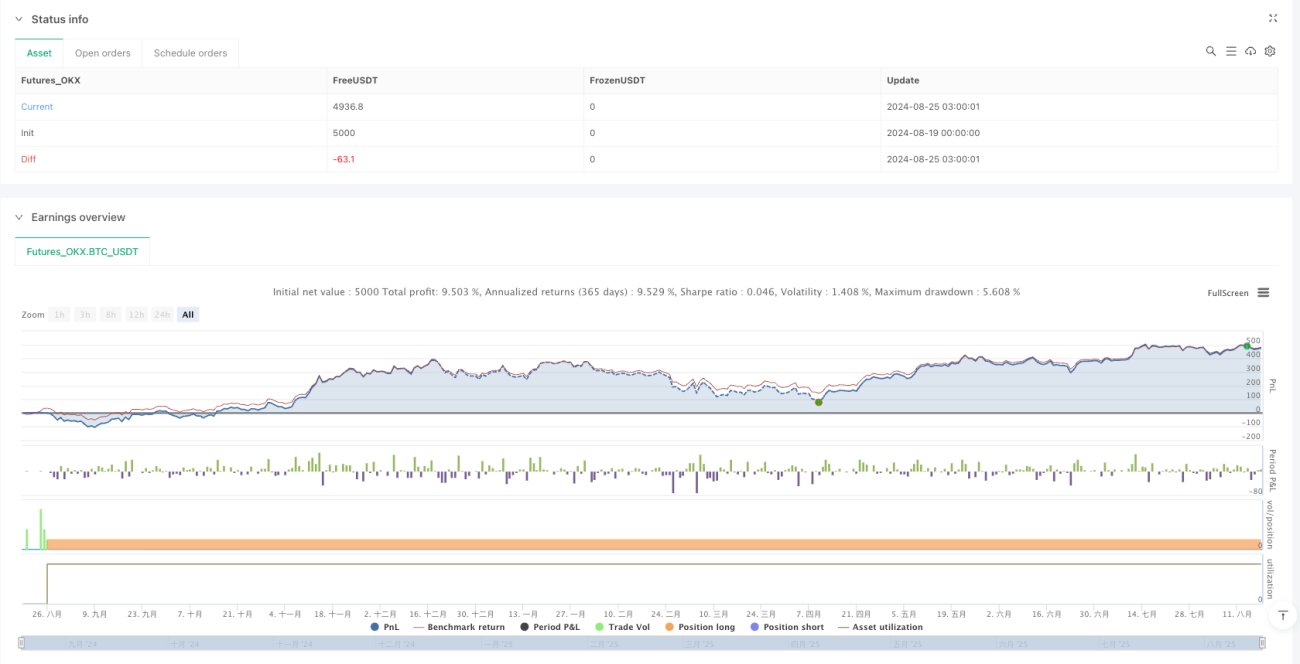
/*backtest
start: 2024-08-19 00:00:00
end: 2025-08-18 00:00:00
period: 1h
basePeriod: 1h
exchanges: [{"eid":"Futures_OKX","currency":"BTC_USDT","balance":5000}]
*/

//@version=5
strategy("Tweezers Bottom Strategy 5m - Long Only", overlay=true, initial_capital=10000, default_qty_type=strategy.percent_of_equity, default_qty_value=10)

// Параметры- 1