
Overview
The Liquidity Sweep and Trend Following Quantitative Trading Strategy is a dual technical analysis approach that combines market liquidity sweeps with trend following. This strategy primarily identifies entry signals by recognizing price breakouts of recent highs and lows (liquidity sweeps) along with relative position to moving averages (trend confirmation). The strategy utilizes a Simple Moving Average (SMA) as a trend determination tool and employs Average True Range (ATR) to dynamically set stop-loss and take-profit levels, adapting to changes in market volatility.
Strategy Principles
The core principles of this strategy are based on two key market behaviors: liquidity sweeps and trend direction.
-
Liquidity Sweep Identification:
- The strategy uses the
swingLookbackparameter (default: 3) to define the lookback period for recent highs and lows - When price breaks above recent highs, it's identified as a bullish liquidity sweep (bullSweep)
- When price breaks below recent lows, it's identified as a bearish liquidity sweep (bearSweep)
- The strategy uses the
-
Trend Direction Confirmation:
- Uses a Simple Moving Average (default period: 20) as trend reference
- Closing price above the moving average is considered an uptrend
- Closing price below the moving average is considered a downtrend
-
Entry Signals:
- Long entry: Price breaks above recent high (liquidity sweep) and is in an uptrend
- Short entry: Price breaks below recent low (liquidity sweep) and is in a downtrend
-
Risk Management:
- Dynamic stop-loss: Based on ATR (default period: 14), set at 1.5x ATR
- Dynamic take-profit: Also based on ATR, set at 3x ATR, providing a 2:1 risk-reward ratio
-
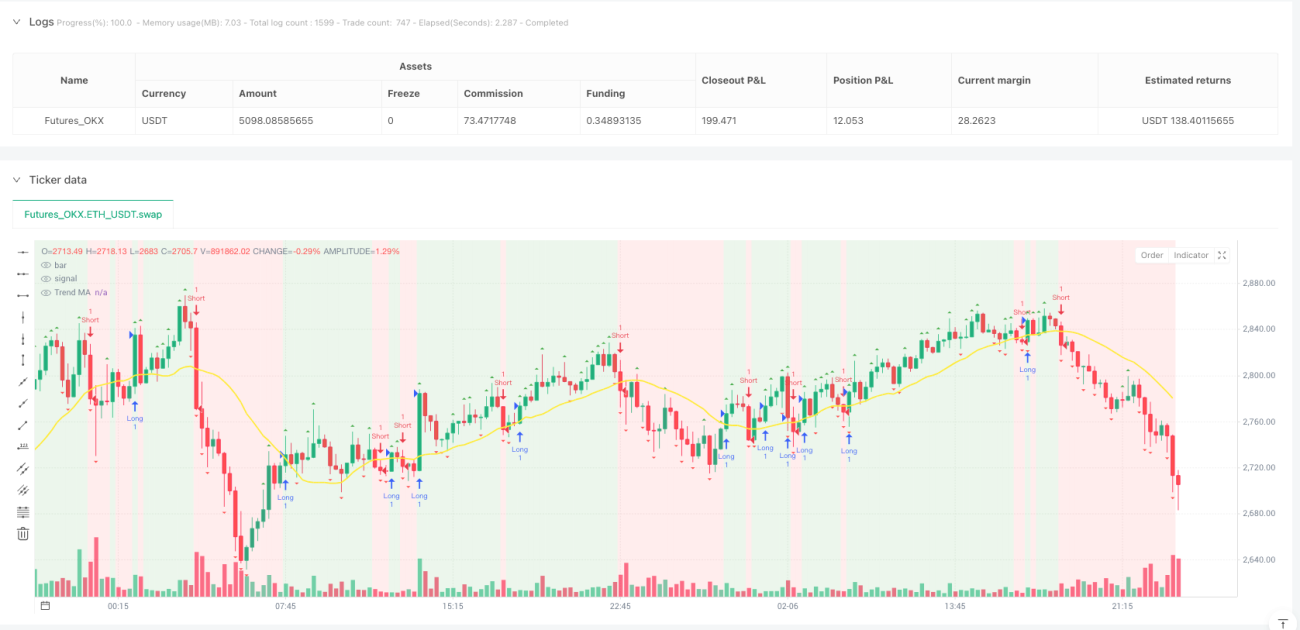
Visualization Components:
- Trend moving average display
- Liquidity sweep markers
- Trend background color
- Buy/sell signal alerts
Strategy Advantages
-
Market Structure and Trend Integration: By combining liquidity sweeps (market structure) and moving averages (trend), the strategy can capture more reliable trading signals and avoid false breakouts.
-
Dynamic Risk Management: Using ATR to adjust stop-loss and take-profit levels allows risk management to adapt to market volatility, providing wider stops in highly volatile markets and tighter stops in less volatile markets.
-
Simple Yet Effective Parameters: The strategy uses only a few key parameters, such as moving average period, ATR period, stop-loss multiplier, take-profit multiplier, and lookback period, making it easy to understand and optimize.
-
Rich Visual Feedback: The strategy provides intuitive visual indicators including trend background color, liquidity sweep markers, and moving average line, helping traders quickly assess market conditions.
-
Built-in Alert Functionality: The strategy integrates buy/sell signal alerts, making it convenient for traders to receive timely notifications of trading opportunities.
-
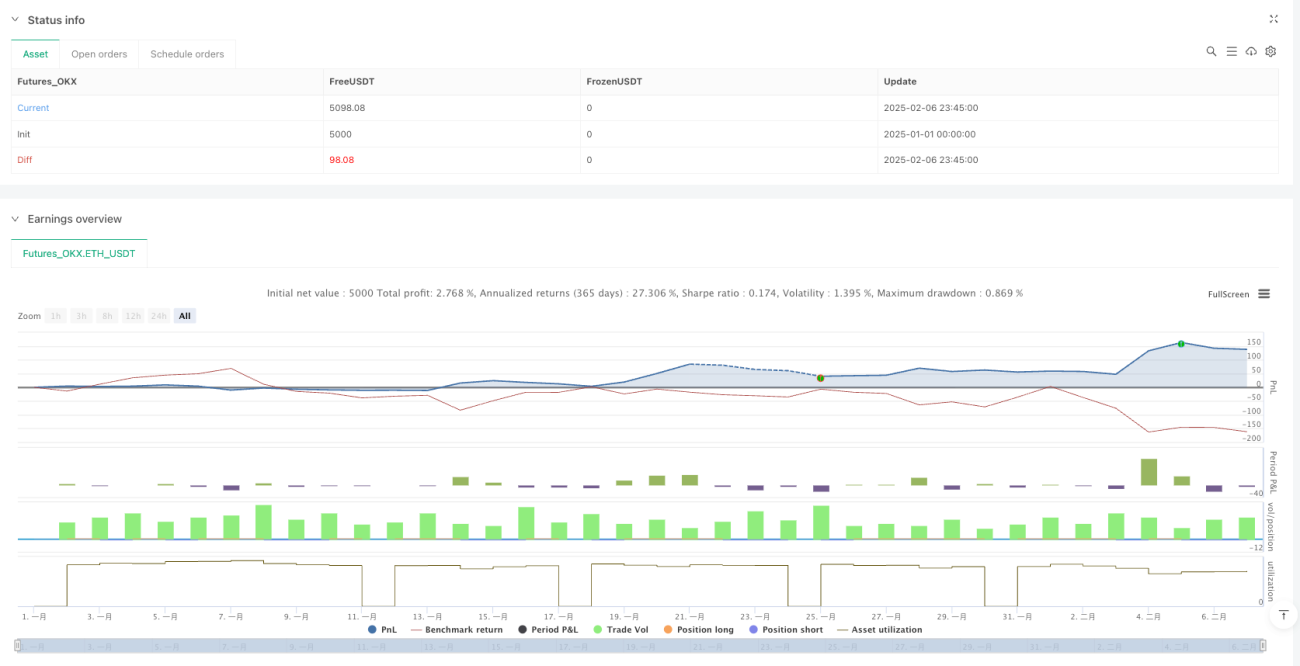
Integrated Money Management: The strategy uses account equity percentage for position sizing, defaulting to 10%, ensuring position size adjusts appropriately as the account grows.
Strategy Risks
-
False Breakout Risk: Despite incorporating trend confirmation, liquidity sweeps can still lead to false breakout signals, especially during highly volatile markets or consolidation periods. Solution: Consider adding additional filtering conditions such as volume confirmation or volatility filters.
-
Overtrading Risk: When the
swingLookbackparameter is set too small (such as the default of 3), it may generate too many trading signals. Solution: Adjust this parameter based on the characteristics of the trading instrument and timeframe, or add signal confirmation mechanisms. -
Stop-Loss Too Tight/Wide Risk: Fixed ATR multipliers may not be flexible enough in certain market conditions. Solution: Consider dynamically adjusting ATR multipliers based on market state (such as volatility changes or trend strength).
-
Trend Reversal Risk: Moving averages as lagging indicators may not respond quickly enough during trend reversals. Solution: Consider using more sensitive indicators such as ALMA or dual EMA crossovers to determine trends.
-
Fixed Risk-Reward Ratio Limitation: The strategy uses fixed ATR multipliers (default 1.5x for stop-loss, 3x for take-profit), not considering support/resistance levels in market structure. Solution: Improve by dynamically adjusting target prices based on market structure.
Strategy Optimization Directions
-
Multiple Timeframe Analysis: Introducing trend confirmation from higher timeframes can significantly improve strategy reliability. For example, only trading when the trend direction in larger timeframes is consistent can reduce the risk of counter-trend trading.
-
Dynamic Parameter Adjustment: Dynamically adjust
swingLookback, stop-loss, and take-profit multipliers based on market volatility or volume changes. For instance, increase the lookback period in highly volatile markets to reduce false signals. -
Add Volume Confirmation: Use volume as a confirmation indicator, only confirming signals when liquidity sweeps are accompanied by increased volume, which can significantly reduce false breakout trades.
-
Introduce Market Structure Recognition: Enhance the strategy's understanding of price structure, such as identifying higher highs/lower lows patterns, or identifying support/resistance zones, thereby optimizing entry points and target prices.
-
Adaptive Moving Averages: Consider using adaptive moving averages (such as KAMA or ALMA) instead of simple moving averages to better adapt to different market conditions.
-
Time Filters: Add time filters to avoid known inefficient trading sessions, such as sideways periods during Asian sessions or high volatility periods before and after important economic data releases.
-
Position Management Optimization: The current strategy uses a fixed equity percentage (10%), consider dynamically adjusting position size based on volatility or risk models, or implementing a pyramid scaling strategy.
Summary
The Liquidity Sweep and Trend Following Quantitative Trading Strategy is a comprehensive trading system that combines technical analysis and risk management. By identifying liquidity sweep behaviors in the market and combining them with trend confirmation, the strategy aims to capture high-probability trading opportunities. Its dynamic risk management mechanism uses ATR to adapt to market volatility, providing adaptive stop-loss and take-profit levels.
The main advantages of the strategy lie in its simple yet effective parameter setup and rich visual feedback, making it suitable for traders of all levels. However, the strategy also has risks of false breakouts and overtrading, which can be optimized by adding additional filtering conditions and multiple timeframe analysis.
Future optimization directions include multiple timeframe analysis, dynamic parameter adjustment, volume confirmation, and enhanced market structure recognition. Through these optimizations, the reliability and profitability of the strategy can be further improved, reducing false signals and unnecessary trading frequency.
For traders seeking to combine market structure and trend following methods, this strategy provides a solid foundation framework that can be customized and expanded according to individual risk preferences and trading styles.
- 1