Automated Trendline Channel Breakout Quantitative Trading Strategy

Overview
The Automated Trendline Channel Breakout Quantitative Trading Strategy is an automated trading system based on price channel breakout principles. This strategy generates trading signals when price breaks through channel boundaries dynamically identified by market highs and lows. The core concept utilizes historical price volatility to determine support and resistance levels, while managing risk through reasonable take-profit and stop-loss ratios. This strategy is particularly suitable for markets with higher volatility, capturing profits from trending breakout movements.
Strategy Principles
The core principle of this strategy is based on price channel breakout theory, with implementation logic as follows:
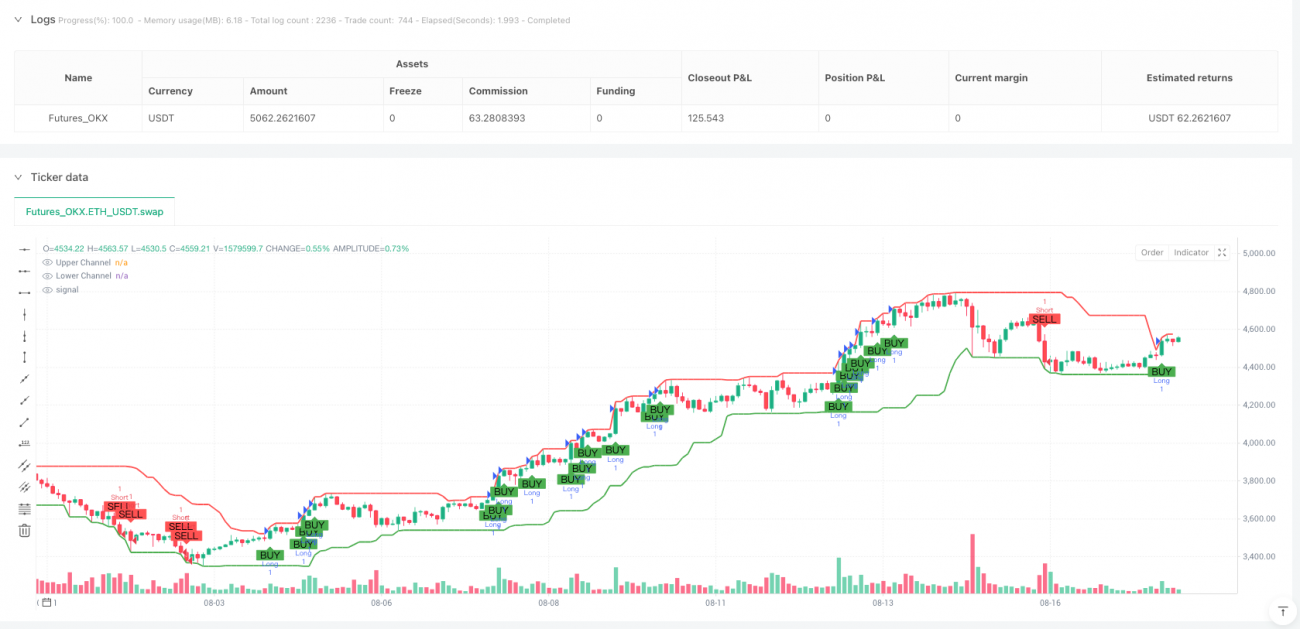
- Identify market highs (HH) and lows (LL) by looking back over a specified period (default 20 candles), which form the foundation of the trend channel.
- Extend outward from these highs and lows by adding a certain percentage of channel width (default 0.5%) to form upper and lower channel lines. The upper channel line serves as resistance, while the lower channel line serves as support.
- Trading signal generation rules:
- When the closing price breaks above the upper channel line, a long signal is generated
- When the closing price breaks below the lower channel line, a short signal is generated
- The strategy employs a dynamic take-profit/stop-loss mechanism:
- For long positions, take-profit is set at 0.5% above entry price, and stop-loss at 0.3% below entry price
- For short positions, take-profit is set at 0.5% below entry price, and stop-loss at 0.3% above entry price
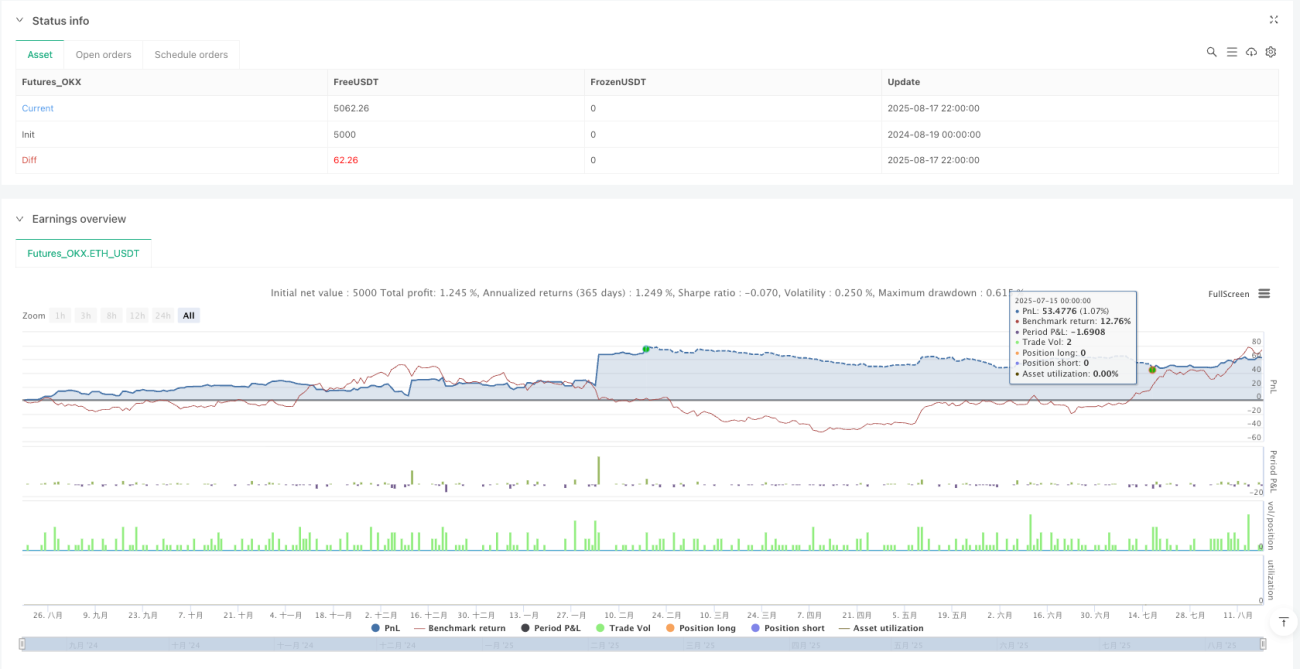
- Money management uses a percentage of account equity approach, defaulting to 10% of account funds per trade, avoiding excessive risk on single trades.
The essence of this strategy is to capture the moment when price breaks out of its historical volatility range. Based on market inertia principles, once price breaks through an established range, it often continues to move in the direction of the breakout.
Strategy Advantages
- Adapts to Market Changes: The strategy dynamically calculates highs and lows, allowing the channel to automatically adapt to different market environments without manual parameter adjustments.
- Clear Trading Signals: The strategy provides clear buy and sell signals, reducing subjective judgment factors and suitable for systematic execution.
- Built-in Risk Management: The strategy integrates take-profit and stop-loss mechanisms, with each trade having a preset risk-reward ratio, effectively controlling single trade risk.
- Reasonable Fund Management: Uses account percentage method for position sizing, automatically adjusting trade volume as account size changes, avoiding overtrading.
- Visualized Trading Signals: The strategy marks buy/sell signals and channel lines on the chart, intuitively displaying trading logic for easier understanding and monitoring.
- Alert Functionality: Integrates trading signal alerts, reminding traders at critical moments without requiring constant chart watching.
- Adjustable Parameters: Key parameters such as lookback period, channel width, and take-profit/stop-loss ratios can all be customized, facilitating optimization for different market environments.
Strategy Risks
- False Breakout Risk: Markets may exhibit brief breakouts followed by retracements, triggering false signals that lead to unnecessary losses when price returns to the original range. Solution: Consider adding confirmation mechanisms, such as requiring two consecutive closing candles beyond the channel line before triggering a trade.
- Unsuitable for Ranging Markets: In sideways, choppy markets, price may frequently touch channel boundaries without forming effective trends, leading to frequent trading with high stop-loss trigger rates. Solution: Add market state filters, such as volatility indicators, only allowing trades when market volatility reaches certain levels.
- Fixed Ratio Take-Profit/Stop-Loss Lacks Flexibility: The optimal take-profit/stop-loss ratio may differ under various market conditions; fixed ratios might lead to taking profits too early or stopping losses too late in certain market conditions. Solution: Consider dynamically adjusting take-profit/stop-loss ratios based on volatility.
- Lack of Trend Filtering: The strategy doesn't distinguish major trend direction, potentially generating long signals during downtrends and vice versa. Solution: Add longer-period moving averages as trend filters, only trading when signal direction aligns with the trend.
- Parameter Sensitivity: Strategy performance is sensitive to lookback period and channel width parameters; improper parameter selection may lead to poor strategy performance. Solution: Conduct thorough parameter optimization and backtesting to find optimal parameter combinations for target markets.
Strategy Optimization Directions
- Add Trend Filters: Incorporate longer-period moving averages or other trend indicators, only executing trades when the major trend direction aligns with the signal direction. This can significantly reduce counter-trend trading risks and improve overall win rates. Specific implementation could consider adding 50 or 200-day moving averages as trend judgment criteria.
- Optimize Signal Confirmation Mechanism: Add breakout confirmation logic, such as requiring price to maintain position outside the channel for two or more consecutive candles after breaking out before triggering a trade. This can effectively reduce losses from false breakouts.
- Dynamically Adjust Parameters Based on Volatility: Link channel width and take-profit/stop-loss ratios to market volatility, using wider channels and larger take-profit/stop-loss ratios in high-volatility environments, and the opposite in low-volatility environments. This better adapts to different market conditions.
- Add Time Filters: Implement trading time restrictions to avoid major economic data releases or low-liquidity periods, reducing risks from abnormal volatility.
- Add Volume Confirmation: Integrate volume analysis, only confirming breakout signals when accompanied by increased volume, improving breakout validity.
- Introduce Machine Learning Optimization: Use machine learning algorithms to dynamically predict optimal parameter combinations, automatically adjusting strategy parameters based on recent market characteristics for more intelligent trading decisions.
- Multi-Timeframe Analysis: Integrate signals from multiple time periods, only executing trades when signals from multiple timeframes align, improving signal quality.
These optimization directions aim to enhance strategy robustness and adaptability by reducing false signals and strengthening trend capture capabilities, enabling the strategy to maintain relatively stable performance across different market environments.
Summary
The Automated Trendline Channel Breakout Quantitative Trading Strategy is a systematic trading method based on technical analysis principles, capturing market trend changes by identifying price channel breakouts. The strategy's core advantages lie in its strong adaptability, clear signals, and comprehensive risk management, making it suitable for medium to long-term trend trading. However, the strategy also faces issues such as false breakout risks and poor performance in ranging markets.
By adding trend filters, optimizing signal confirmation mechanisms, introducing volatility-adaptive parameters, and other enhancements, the strategy's robustness and profitability can be significantly improved. Future considerations could include integrating machine learning technologies to further optimize parameter selection and signal quality.
For traders, this strategy provides a systematic, disciplined trading framework that reduces emotional factors, suitable as a medium to long-term trend capture tool. However, it is recommended to conduct thorough parameter optimization and backtesting validation before live implementation, and adjust money management settings according to personal risk preferences.
- 1