Institutional Liquidity Capture and Supply-Demand Zone Identification Strategy

Overview
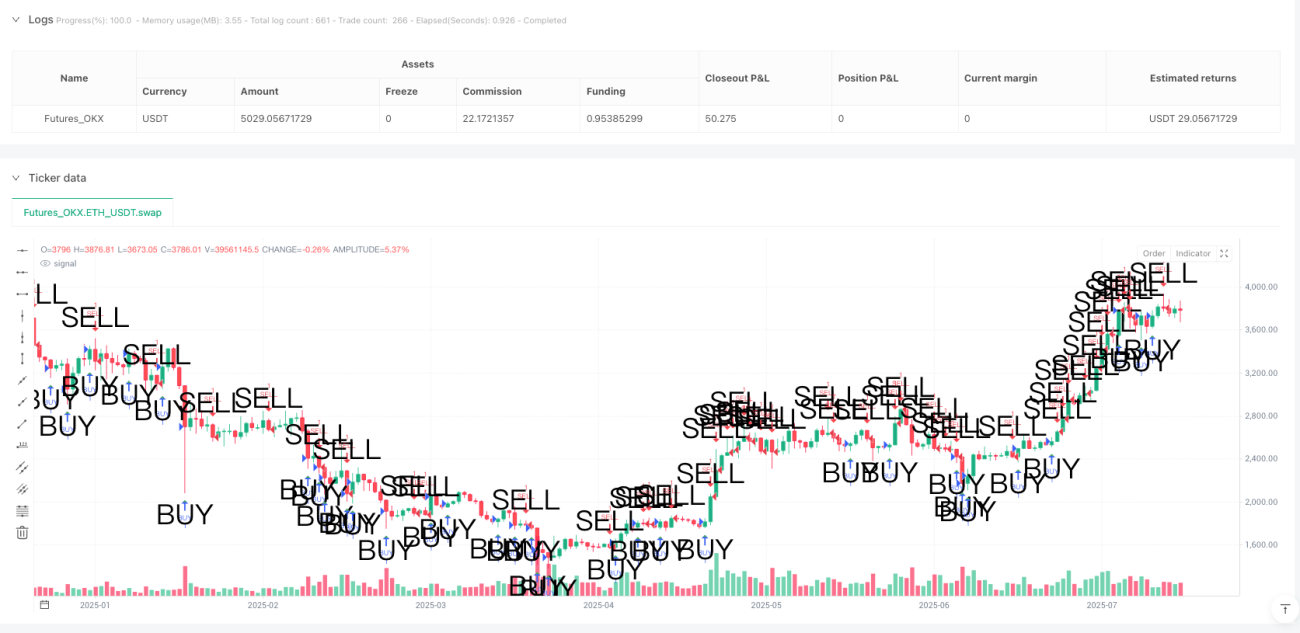
This strategy is a quantitative trading system based on institutional trading behavior, primarily focusing on identifying liquidity capture points and supply/demand zones in the market. The core idea is to capture two price patterns frequently used by institutions: Liquidity Sweep and Engulfing Pattern. By identifying these patterns, the strategy technically determines potential entry points, automatically sets stop-loss and take-profit levels, and visually plots supply and demand zones on the chart, providing traders with intuitive visual references.
Strategy Principles
The strategy operates based on the following core principles:
-
Liquidity Sweep Identification:
- The strategy identifies liquidity sweeps by comparing current prices with the highest/lowest prices over a specific period (default 20 periods).
- When price breaks above a previous high and then falls back, it's considered a bearish liquidity sweep; when price breaks below a previous low and then rebounds, it's considered a bullish liquidity sweep.
- This behavior typically indicates that large institutions are seeking liquidity to execute their large orders.
-
Engulfing Pattern Identification:
- The strategy looks for strong bullish/bearish engulfing candle patterns, which signal a drastic change in market sentiment.
- A bullish engulfing pattern requires the current close to be higher than the open, the previous candle's close to be lower than its open, the current close to be higher than the previous candle's open, and the current open to be not higher than the previous candle's close.
- The bearish engulfing pattern is the opposite, and patterns meeting these conditions indicate a potential market reversal.
-
Entry Conditions:
- Long entry condition: Occurrence of a liquidity sweep (price breaking through previous lows) or a bullish engulfing pattern.
- Short entry condition: Occurrence of a liquidity sweep (price breaking through previous highs) or a bearish engulfing pattern.
-
Risk Management:
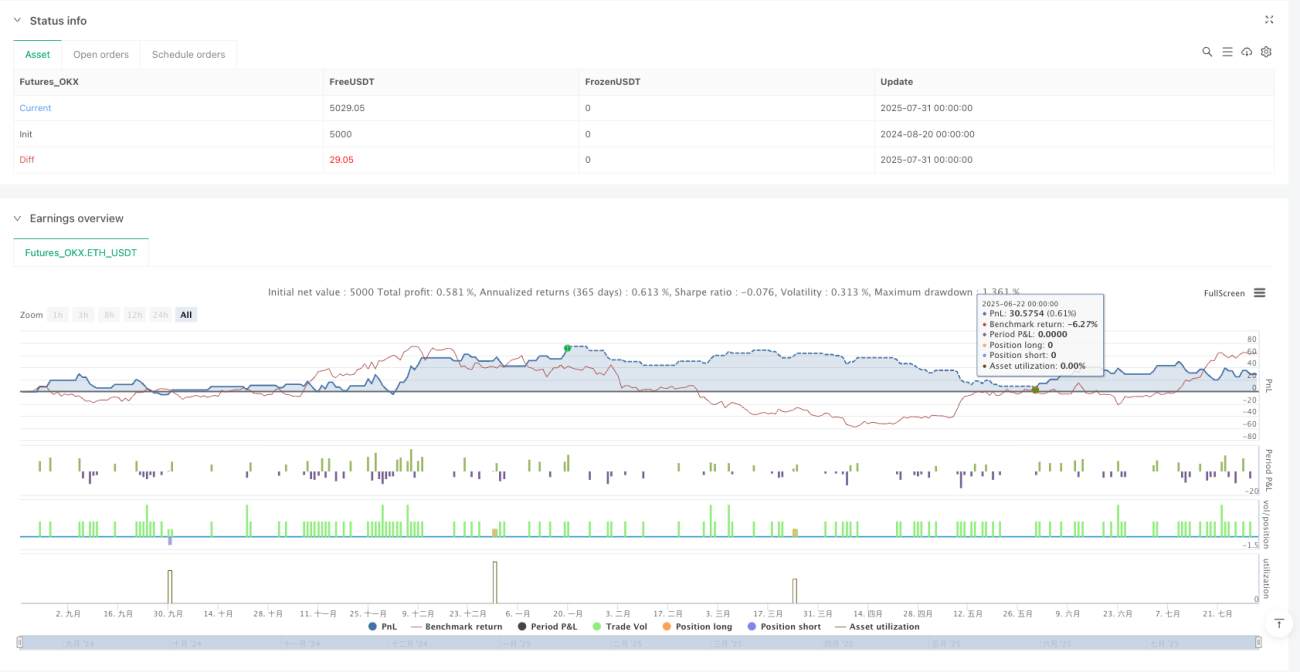
- Each trade sets percentage-based stop-loss and take-profit levels, with defaults at 1% for stop-loss and 2% for take-profit, ensuring a risk-reward ratio of 1:2.
- Stop-loss is placed at a specific percentage below (for longs) or above (for shorts) the entry price.
- Take-profit is placed at a specific percentage above (for longs) or below (for shorts) the entry price.
-
Supply/Demand Zone Visualization:
- After confirming an entry signal, the strategy draws supply/demand zone boxes on the chart.
- Demand zones (long entry points) are displayed as transparent green areas, ranging from the low to 40% above the low.
- Supply zones (short entry points) are displayed as transparent red areas, ranging from the high to 40% below the high.
- These zones extend 10 bars to the right, providing a visual reference for potential support/resistance areas.
Strategy Advantages
-
Institutional Behavior Tracking: The strategy mimics the trading behavior of large institutions by identifying liquidity capture points, providing an edge that is closer to actual market mechanics than simple technical indicators.
-
Clear Visual Signals: Through the use of shapes and color coding (green triangles for longs, red triangles for shorts), the strategy provides clear visual entry signals, allowing traders to quickly identify potential trading opportunities.
-
Supply/Demand Zone Mapping: By plotting supply and demand zone boxes, the strategy provides visual references for where price may encounter support or resistance, which is valuable for understanding market structure.
-
Built-in Risk Management: The strategy features preset stop-loss and take-profit percentages, ensuring each trade has a predefined risk-reward ratio, which is fundamental to healthy trading management.
-
High Adaptability: With adjustable parameters (such as lookback period, stop-loss percentage, and take-profit percentage), the strategy can be optimized for different market conditions and personal risk preferences.
-
Compound Signal System: The strategy doesn't rely on a single signal but combines both liquidity sweep and engulfing pattern signals, reducing the possibility of false signals and improving the accuracy of entry decisions.
-
Price Action Based: The strategy is primarily based on price action rather than derivative indicators, reducing lag and staying closer to real-time market dynamics.
Strategy Risks
-
False Breakout Risk: Markets may experience false breakouts where price breaks through previous highs or lows but fails to continue, leading to erroneous signals. Solutions could include adding confirmation indicators or adjusting the lookback period.
-
Risk in High Volatility Markets: In highly volatile markets, engulfing patterns may appear frequently but not have the same predictive power, potentially leading to overtrading. In such environments, consider adding a filter for pattern size or temporarily disabling certain signals.
-
Fixed Stop-Loss/Take-Profit Limitations: Using fixed percentage stop-loss and take-profit may not be suitable for all market conditions, especially in markets with varying volatility. Consider dynamic stop-loss/take-profit settings based on ATR (Average True Range).
-
Parameter Sensitivity: The strategy's performance is highly dependent on the chosen parameters, such as lookback period length. Different markets and timeframes may require different parameter settings, necessitating detailed backtesting and optimization.
-
Supply/Demand Zone Accuracy: Automatically generated supply and demand zones may not be as accurate as those manually identified by professional traders, as they are based solely on single price points and fixed percentages. Consider incorporating volume or other price structure elements to improve zone definition.
-
No Market Environment Filtering: The strategy generates signals in all market conditions, not distinguishing between trending, ranging, or high volatility environments. In certain market environments, specific entry conditions may be less reliable; consider adding market state filters.
-
Backtesting Bias: During backtesting, the strategy may show better results than in actual trading due to future information leakage or over-optimization; caution should be exercised when trading live.
Strategy Optimization Directions
-
Add Trend Filters: By adding trend identification indicators (such as moving averages or ADX), ensure that trade direction aligns with the overall market trend, avoiding counter-trend trading and improving success rates. This optimization can address the strategy's potential issue of generating too many trading signals in ranging markets.
-
Integrate Volume Confirmation: Incorporate volume analysis into the signal confirmation process, generating trading signals only when price action is accompanied by significant volume changes. This helps filter out low-quality breakouts or engulfing patterns, as effective price action is typically supported by volume.
-
Dynamic Stop-Loss/Take-Profit: Replace fixed percentage stop-loss/take-profit with dynamic levels based on market volatility (such as ATR). This will make risk management more adaptable to current market conditions, providing wider stops in high volatility and tighter stops in low volatility.
-
Add Time Filters: Certain market sessions may be more suitable for this strategy than others; by adding time filters, avoid trading during low liquidity or unpredictable market sessions.
-
Multi-Timeframe Analysis: Integrate confirmation signals from higher timeframes, trading only when the trend in higher timeframes aligns with the trade direction. This "top-down" approach can improve signal quality.
-
Refine Supply/Demand Zones: Improve the calculation method for supply and demand zones, considering price structure, volume, and multi-timeframe support/resistance levels, making these zones more accurately reflect potential turning points.
-
Add Machine Learning Classifiers: Use machine learning techniques to evaluate the quality of each signal, predicting the likelihood of success based on historical patterns and executing only high-probability trades.
-
Implement Drawdown Control Mechanisms: Implement dynamic position sizing and drawdown control, reducing position size after consecutive losses and gradually increasing it when the strategy is performing well, to protect capital from excessive losses.
Summary
The Institutional Liquidity Capture and Supply-Demand Zone Identification Strategy is a quantitative trading system based on institutional trading behavior and price action, capturing high-probability trading opportunities by identifying liquidity sweeps and engulfing patterns. The main advantages of the strategy lie in its approach close to actual market mechanics, clear visual signal system, and built-in risk management framework.
However, the strategy also faces challenges such as false breakout risk, parameter sensitivity, and market environment adaptability issues. By adding trend filters, integrating volume confirmation, implementing dynamic stop-loss/take-profit, adding time filters, adopting multi-timeframe analysis, refining supply/demand zone definitions, and introducing machine learning techniques, the strategy's robustness and performance can be significantly improved.
For traders interested in using this strategy, it is recommended to conduct thorough backtesting and parameter optimization before live trading, and to consider the strategy's performance in different market environments. Through continuous monitoring and adjustment, this strategy can become a powerful trading tool, helping traders better understand and leverage institutional behavior patterns in the market.
- 1