Momentum Breakout Trading Strategy and Backtesting System

Overview
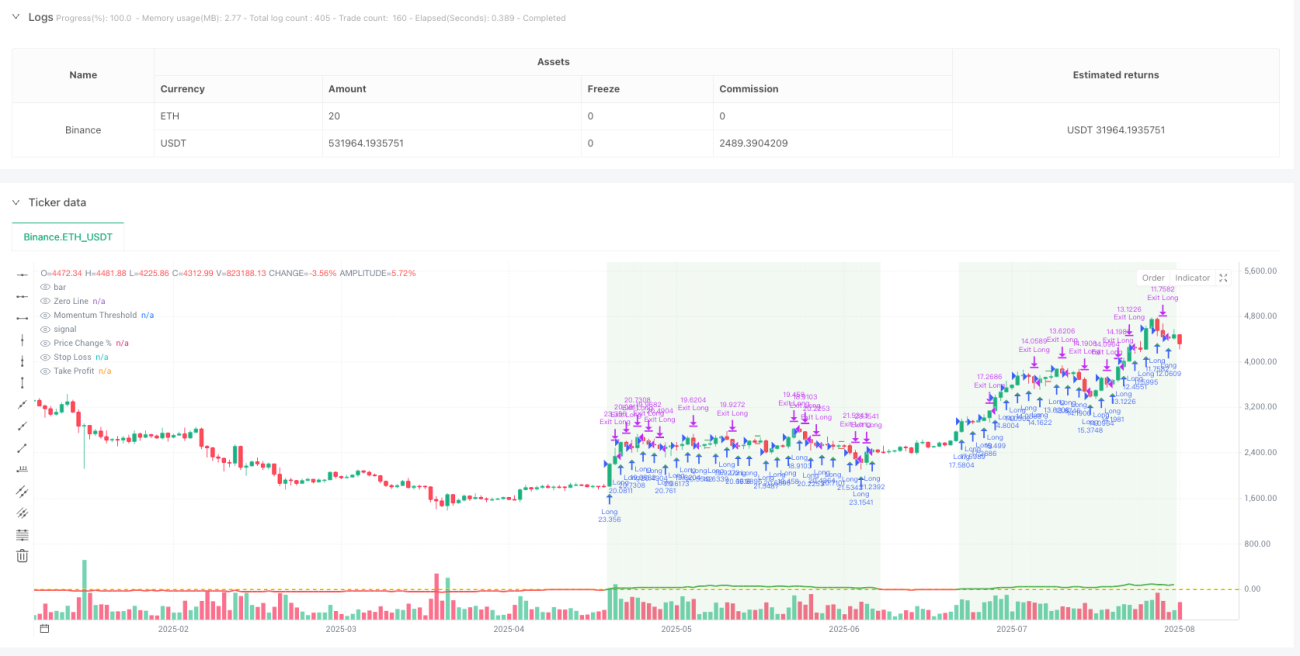
The Momentum Breakout Trading Strategy is a momentum-based trading system that identifies potential breakout opportunities by monitoring price change percentages over a specified timeframe. When the price rises above a predefined threshold within a lookback period, the strategy automatically enters a long position with preset stop-loss and take-profit levels to manage risk. This strategy is particularly well-suited for volatile markets, capturing opportunities from strong short-term price movements.
Strategy Principles
The core of this strategy lies in measuring momentum through price percentage change over a specific time range. The strategy implementation follows this logic:
- Parameters allow users to customize momentum threshold, lookback period, stop-loss, and take-profit percentages
- Calculate the percentage change between current close price and close price from the lookback period
- Enter a long position when the price change percentage exceeds the set momentum threshold and no position is currently open
- Set stop-loss and take-profit levels based on entry price immediately after entry
- Manage trade exits automatically using stop-loss and take-profit conditions
The strategy calculates price change percentage using the formula price_change_pct = ((close - close[lookback_bars]) / close[lookback_bars]) * 100 and compares it with the user-defined momentum threshold. When the change rate exceeds the threshold and no position is open, a long entry signal is triggered.
Strategy Advantages
-
Parameter Flexibility: The strategy provides multiple adjustable parameters, including stop-loss percentage, take-profit percentage, momentum threshold, and lookback period, allowing traders to optimize according to different market conditions and personal risk preferences.
-
Integrated Risk Management: Through automatic stop-loss and take-profit levels, the strategy incorporates risk management mechanisms that help traders limit losses per trade and lock in profits.
-
Rich Visual Feedback: The strategy includes various visualization elements, including entry signal markers, stop-loss and take-profit level lines, momentum indicator line and threshold line, and background color changes, enabling traders to intuitively understand market conditions and strategy logic.
-
Real-time Information Display: A table shows current momentum value, position size, entry price, and net profit/loss, providing real-time updates of key trading information.
-
Capital Management Integration: The strategy uses account equity percentage for position sizing rather than fixed lot sizes, facilitating dynamic capital management and risk control.
Strategy Risks
-
False Breakout Risk: Markets may briefly exceed the momentum threshold before quickly reversing, leading to false breakout signals and unnecessary trades. Solution: add additional confirmation indicators or delayed entry conditions.
-
Parameter Sensitivity: Strategy performance heavily depends on parameter settings, and different market environments may require different parameter configurations. Traders should optimize parameters through comprehensive backtesting under various market conditions.
-
One-directional Trading Limitation: The current strategy only supports long trades, ignoring potential short opportunities, which may result in missed profit opportunities in declining markets. Solution: extend the strategy to include short entry logic.
-
Stop Loss Slippage Risk: In highly volatile or low liquidity markets, prices may gap through stop-loss levels, causing actual losses to exceed expectations. Consider using more conservative stop-loss settings or adjusting stop-loss levels based on market volatility.
-
Overtrading Risk: In highly volatile markets, the strategy may trigger signals frequently, leading to overtrading and increased transaction costs. This risk can be mitigated by increasing the strictness of entry conditions or introducing cooldown periods.
Strategy Optimization Directions
-
Multiple Timeframe Analysis: Integrate trend confirmation from longer timeframes, ensuring trade direction aligns with the larger trend. This can be implemented by analyzing price direction on longer timeframes and only trading in the direction of the main trend, reducing the risk of counter-trend trades.
-
Add Reverse Trading Logic: Implement short entry conditions, enabling the strategy to profit in declining markets. Complete bidirectional trading logic can improve strategy adaptability across different market environments.
-
Dynamic Parameter Adjustment: Automatically adjust momentum threshold, stop-loss, and take-profit levels based on market volatility. Use higher thresholds and wider stops in high volatility markets, and lower thresholds with tighter stops in low volatility environments.
-
Incorporate Volume Confirmation: Use trading volume as an additional confirmation indicator, ensuring price breakouts are accompanied by volume increases, which helps reduce false breakout signals.
-
Add Technical Indicator Filters: Introduce other technical indicators such as RSI, MACD, or moving averages as auxiliary confirmation tools to improve entry signal quality. For example, only consider long signals when RSI shows oversold conditions.
-
Optimize Money Management: Implement volatility-based position sizing, reducing exposure in high volatility markets and increasing position size in low volatility markets, thereby optimizing risk-reward ratios.
Summary
The Momentum Breakout Trading Strategy is a simple yet effective trading system based on price change rates, particularly suitable for capturing opportunities from strong short-term price increases. By monitoring price change percentages over a specific timeframe, the strategy can identify potential breakout opportunities and execute trades automatically.
The main advantages of this strategy include parameter flexibility, built-in risk management mechanisms, and rich visual feedback. However, it also faces risks such as false breakouts, parameter sensitivity, and one-directional trading limitations. By implementing multiple timeframe analysis, adding reverse trading logic, dynamic parameter adjustment, volume confirmation, and technical indicator filtering, the robustness and profitability of the strategy can be significantly improved.
For traders looking to capitalize on short-term price momentum, this is a good starting point that can be further customized and optimized according to personal trading style and market preferences.
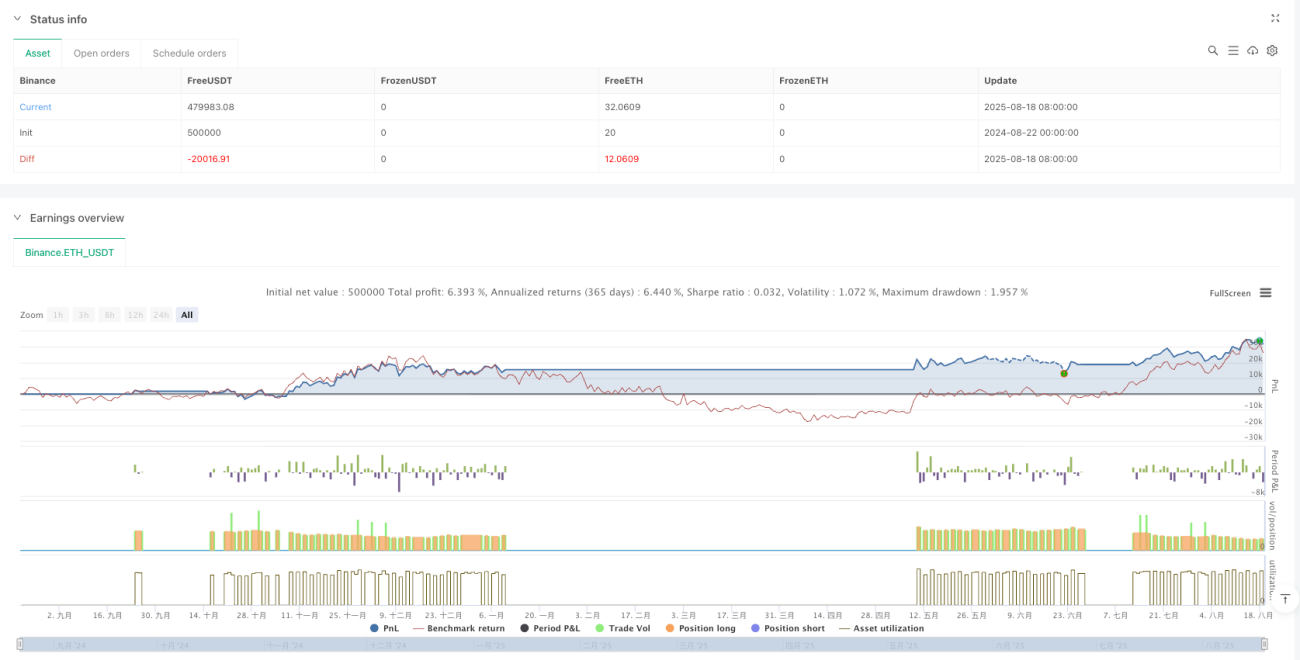
/*backtest
start: 2024-08-22 00:00:00
end: 2025-08-19 08:00:00
period: 1d
basePeriod: 1d
exchanges: [{"eid":"Binance","currency":"ETH_USDT","balance":500000}]
*/

//@version=5
strategy("Momentum Breakout Strategy", overlay=true, initial_capital=10000, default_qty_type=strategy.percent_of_equity, default_qty_value=10)

// Input parameters- 1