Advanced Multi-Indicator Crypto Scalping Strategy

EMA RSI MACD BB VOLUME
Created on: 2025-09-08 13:24:50 Modified on: 2025-09-08 13:24:50
Copy: 13 Number of hits: 520
avatar of ianzeng123 ianzeng123
2
Follow
319
Followers

 Advanced Multi-Indicator Crypto Scalping Strategy  Advanced Multi-Indicator Crypto Scalping Strategy

🚀 How Powerful Is This Strategy Really?

You know what? This strategy is like installing “eagle eyes” for your trading! Specifically designed for 1-minute and 5-minute ultra-short-term trading, it combines 5 of the most powerful technical indicators: fast/slow EMA, RSI, MACD, Bollinger Bands, plus a volume filter. Simply put, it helps you precisely capture opportunities in every small market fluctuation!

💡 Key Point! How Does This Combo Work?

Imagine this strategy as a super strict “interviewer” - only trading opportunities that simultaneously meet multiple conditions can pass the screening:

Long signals must satisfy: Price above fast EMA, MACD golden cross with positive values, breakout above Bollinger upper band, RSI between 50-80, plus sufficient volume support. It’s like requiring someone to be good-looking, talented, AND have a great personality - that strict!

Short signals work in reverse: All conditions must be met in the opposite direction, ensuring every trade has solid technical backing.

⚡ Pitfall Guide: Why Choose Ultra-Short Term?

The smartest part of this strategy lies in its risk control! Stop loss set at 0.5%, take profit at 1.0%, achieving a 1:2 risk-reward ratio. It’s like the perfect interpretation of “small bets for fun” - each loss is tiny, but profits can double!

Plus, it has a thoughtful design: automatically disables candlestick pattern recognition on 1-minute charts because ultra-short-term K-line patterns have too much noise and can mislead judgment. It’s as smart as automatic noise reduction in noisy environments!

🎯 Practical Application: What Problems Can This Strategy Solve?

Suitable for: Friends who want to day-trade in cryptocurrency markets, especially those hoping to accumulate profits through small, frequent trades.

Pain points solved: Say goodbye to false signals from single indicators! Through multiple confirmation mechanisms, it greatly improves signal reliability. Meanwhile, strict risk control ensures that even wrong judgments result in controllable losses.

Remember, this strategy is like a precision scalpel - it works best on high-liquidity cryptocurrency pairs. Combined with good money management, it can become a powerful assistant in your trading arsenal!
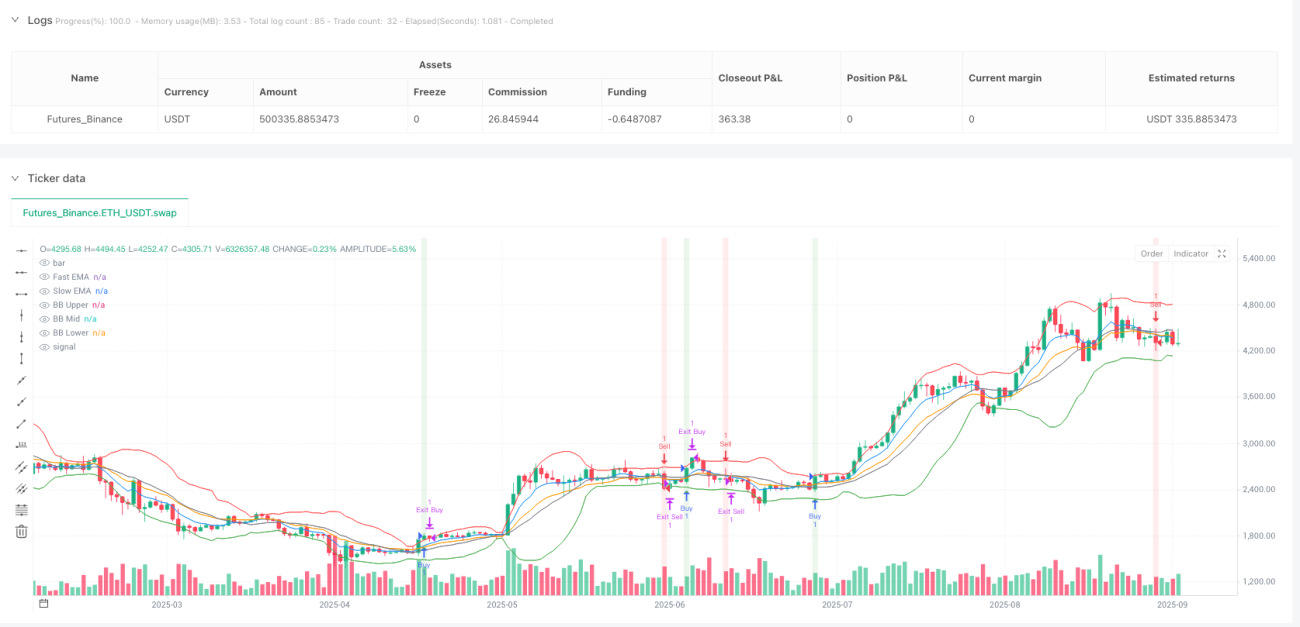
Strategy source code
/*backtest
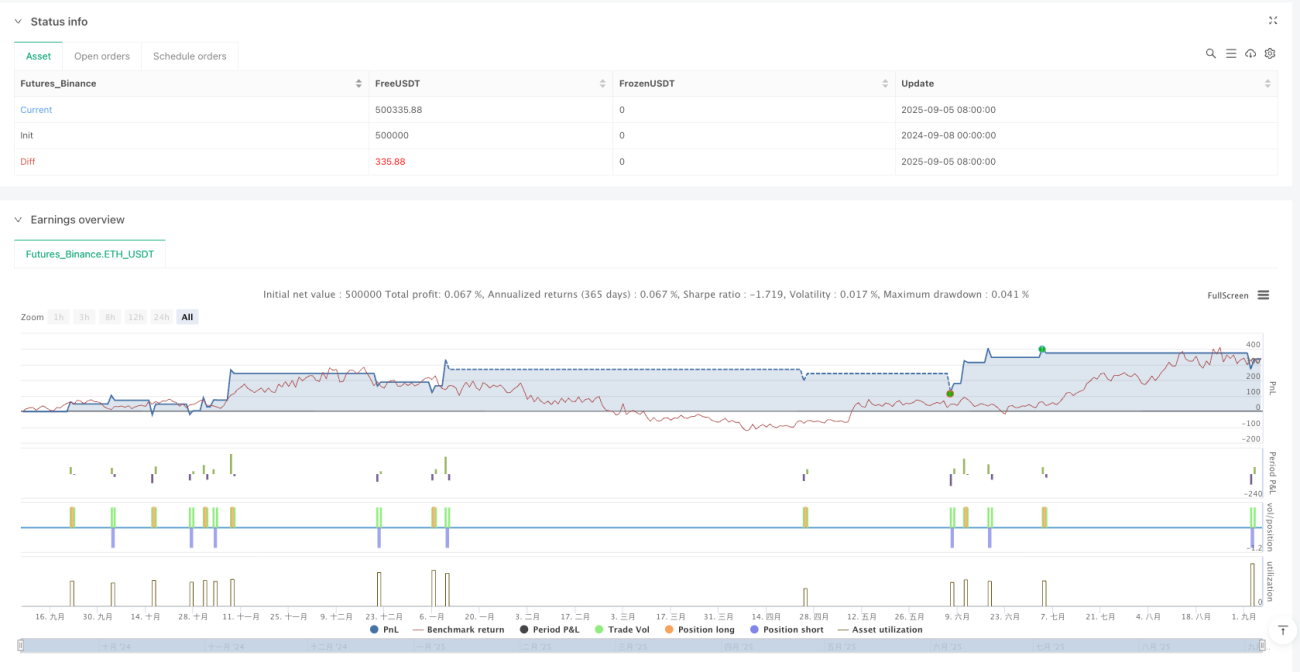
start: 2024-09-08 00:00:00
end: 2025-09-06 08:00:00
period: 1d
basePeriod: 1d
exchanges: [{"eid":"Futures_Binance","currency":"ETH_USDT","balance":500000}]
*/

//@version=5
strategy("Advanced Crypto Scalping Strategy - 1 & 5 Min Charts", overlay=true, margin_long=100, margin_short=100)

// Inputs for customization (optimized for 1-min and 5-min timeframes)
emaFastLen = input.int(7, "Fast EMA Length", minval=1, tooltip="Use 5-8 for 1-min, 7-10 for 5-min")
emaSlowLen = input.int(14, "Slow EMA Length", minval=1, tooltip="Use 10-15 for 1-min, 14-21 for 5-min")
rsiLen = input.int(10, "RSI Length", minval=1, tooltip="Use 8-12 for 1-min, 10-14 for 5-min")
rsiOverbought = input.int(80, "RSI Overbought", minval=50, maxval=100, tooltip="Use 80-85 for 1-min, 75-80 for 5-min")
rsiOversold = input.int(20, "RSI Oversold", minval=0, maxval=50, tooltip="Use 15-20 for 1-min, 20-25 for 5-min")
macdFast = input.int(8, "MACD Fast Length", minval=1, tooltip="Use 6-10 for 1-min, 8-12 for 5-min")
macdSlow = input.int(21, "MACD Slow Length", minval=1, tooltip="Use 15-21 for 1-min, 21-26 for 5-min")
macdSignal = input.int(5, "MACD Signal Smoothing", minval=1, tooltip="Use 4-6 for 1-min, 5-9 for 5-min")
bbLen = input.int(15, "Bollinger Bands Length", minval=1, tooltip="Use 10-15 for 1-min, 15-20 for 5-min")
bbMult = input.float(1.8, "Bollinger Bands Multiplier", minval=0.1, step=0.1, tooltip="Use 1.5-1.8 for 1-min, 1.8-2.0 for 5-min")
slPerc = input.float(0.5, "Stop Loss %", minval=0.1, step=0.1, tooltip="Use 0.3-0.6 for 1-min, 0.5-0.8 for 5-min")
tpPerc = input.float(1.0, "Take Profit %", minval=0.5, step=0.1, tooltip="Use 0.8-1.2 for 1-min, 1.0-1.5 for 5-min")
useCandlePatterns = input.bool(false, "Use Candlestick Patterns", tooltip="Disable for 1-min to reduce noise, enable for 5-min")
useVolumeFilter = input.bool(true, "Use Volume Filter", tooltip="Enable for both timeframes to filter low-volume signals")
signalSize = input.float(2.0, "Signal Arrow Size", minval=1.0, maxval=3.0, step=0.5, tooltip="1.0=tiny, 2.0=small, 3.0=normal")
bgTransparency = input.int(85, "Background Highlight Transparency", minval=0, maxval=100)
labelOffset = input.float(0.8, "Label Offset %", minval=0.5, maxval=5, step=0.1)

// Calculate indicators
emaFast = ta.ema(close, emaFastLen)
emaSlow = ta.ema(close, emaSlowLen)
rsi = ta.rsi(close, rsiLen)
[macdLine, signalLine, _] = ta.macd(close, macdFast, macdSlow, macdSignal)
[bbMid, bbUpper, bbLower] = ta.bb(close, bbLen, bbMult)
volMa = ta.sma(volume, 15)

// Trend determination
bullTrend = close > emaFast and emaFast > emaSlow
bearTrend = close < emaFast and emaFast < emaSlow

// EMA crossover signals
emaCrossBuy = ta.crossover(emaFast, emaSlow)
emaCrossSell = ta.crossunder(emaFast, emaSlow)

// Momentum signals
bullMacd = ta.crossover(macdLine, signalLine) and macdLine > 0
bearMacd = ta.crossunder(macdLine, signalLine) and macdLine < 0

// Channel breakouts
bullBreak = ta.crossover(close, bbUpper)
bearBreak = ta.crossunder(close, bbLower)

// RSI conditions
bullRsi = rsi > 50 and rsi < rsiOverbought
bearRsi = rsi < 50 and rsi > rsiOversold

// Candlestick patterns (optional, less reliable on 1-min)
bullEngulf = close > open and open < low[1] and close > high[1] and useCandlePatterns
bearEngulf = close < open and open > high[1] and close < low[1] and useCandlePatterns
hammer = (high - low) > 2 * (close - open) and close > open and (close - low) / (high - low) > 0.6 and useCandlePatterns
shootingStar = (high - low) > 2 * (open - close) and close < open and (high - close) / (high - low) > 0.6 and useCandlePatterns

bullCandle = bullEngulf or hammer
bearCandle = bearEngulf or shootingStar

// Volume filter
volFilter = volume > volMa * 1.8 or not useVolumeFilter

// Combined buy/sell conditions
mainBuyCondition = bullTrend and bullMacd and bullBreak and bullRsi and bullCandle and volFilter
mainSellCondition = bearTrend and bearMacd and bearBreak and bearRsi and bearCandle and volFilter
buyCondition = mainBuyCondition or emaCrossBuy
sellCondition = mainSellCondition or emaCrossSell

// Strategy entries
var bool isBuyActive = false
var bool isSellActive = false

if (buyCondition and strategy.position_size == 0 and not isBuyActive)
    strategy.entry("Buy", strategy.long)
    label.new(bar_index, low * (1 - labelOffset / 100), emaCrossBuy ? "EMA BUY" : "BUY", color=color.green, style=label.style_label_up, textcolor=color.white, size=size.large)
    isBuyActive := true
    isSellActive := false

if (sellCondition and strategy.position_size == 0 and not isSellActive)
    strategy.entry("Sell", strategy.short)
    label.new(bar_index, high * (1 + labelOffset / 100), emaCrossSell ? "EMA SELL" : "SELL", color=color.red, style=label.style_label_down, textcolor=color.white, size=size.large)
    isSellActive := true
    isBuyActive := false

// Exits
if (strategy.position_size > 0) // Long position
    strategy.exit("Exit Buy", "Buy", stop=strategy.position_avg_price * (1 - slPerc / 100), limit=strategy.position_avg_price * (1 + tpPerc / 100))
    if (strategy.position_size == 0)
        isBuyActive := false

if (strategy.position_size < 0) // Short position
    strategy.exit("Exit Sell", "Sell", stop=strategy.position_avg_price * (1 + slPerc / 100), limit=strategy.position_avg_price * (1 - tpPerc / 100))
    if (strategy.position_size == 0)
        isSellActive := false

// Plot indicators
plot(emaFast, color=color.blue, title="Fast EMA")
plot(emaSlow, color=color.orange, title="Slow EMA")
plot(bbUpper, color=color.red, title="BB Upper")
plot(bbMid, color=color.gray, title="BB Mid")
plot(bbLower, color=color.green, title="BB Lower")

// Plot signals with fixed size to avoid type mismatch
plotshape(buyCondition, title="Buy Signal", location=location.belowbar, color=color.green, style=shape.triangleup, size=size.normal)
plotshape(sellCondition, title="Sell Signal", location=location.abovebar, color=color.red, style=shape.triangledown, size=size.normal)

// Background highlights
bgcolor(buyCondition ? color.new(color.green, bgTransparency) : sellCondition ? color.new(color.red, bgTransparency) : na)