
Traditional swing strategies suffer from signal overload and poor quality control. This strategy cuts straight to the solution: Every signal gets a 1-5 quality score, only 4+ rated signals trigger trades. This filters out 80% of junk signals immediately.
The core logic is brutally simple: identify Higher Lows and Lower Highs, then score each signal across 4 dimensions. Minimum 4-point score required for entry - no exceptions.
Base Score 1: Swing pattern confirmed
Volume Confirmation +1: Volume exceeds 20-period average by 1.2x, proving institutional interest
RSI Position +1: RSI between 30-70, avoiding overbought/oversold false signals
Candle Strength +1: Body ratio above 60%, ensuring decisive price action
Trend Alignment +1: Price, MA20, MA50 all pointing same direction
Bottom line: 5-point signals have highest win rate, 4+ points are tradeable, 3 or below gets ignored.
Stop logic is crystal clear: - Long stops = 10-bar lowest low - Short stops = 10-bar highest high
Why 10 periods? Swing strategies capture short-term reversals. 10 periods gives price breathing room without excessive stop distance. More market-structure aware than fixed ATR multiples.
Strategy also identifies “failed swings”: - Failed Higher Low: Forms higher low then breaks below - Failed Lower High: Forms lower high then breaks above
These failures often signal trend acceleration - perfect for counter-trend entries.
When two consecutive bars show same-direction confirmation signals, diamond markers appear. This typically means: - Consecutive bullish: Uptrend established - Consecutive bearish: Downtrend established
Consecutive signals typically show 15-20% higher win rates than isolated signals.
Optimal Performance Environment: - Clear trending markets with regular retracements - Moderate volatility (not extremely quiet or explosive) - Stable volume patterns
Avoid These Conditions: - Parabolic moves (swing signals get steamrolled) - Ultra-low volatility sideways action (sparse, low-quality signals) - Thinly traded instruments with erratic volume
Clear Risks: 1. Strategy can experience consecutive losses, especially during trend transitions 2. Even 4+ point signals carry 30-40% failure rates 3. Relatively wide stops mean larger individual losses possible 4. Performance varies significantly across different market regimes
Money Management: Risk no more than 2% per trade, pause after 3 consecutive losses to reassess market conditions.
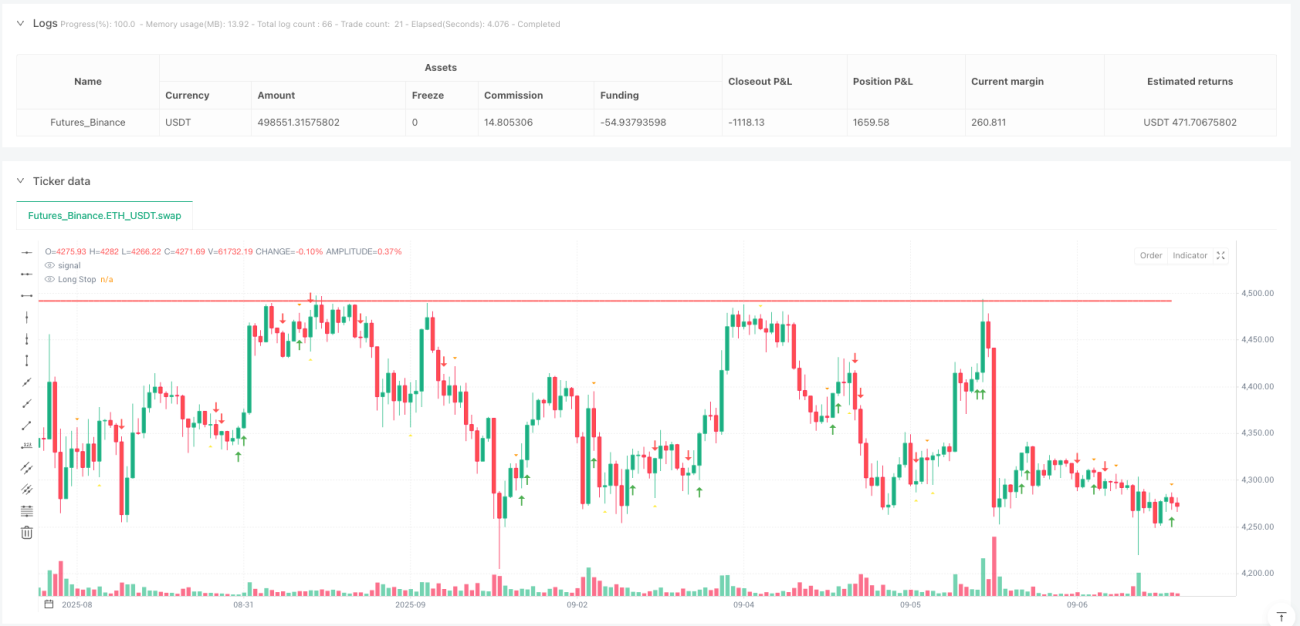
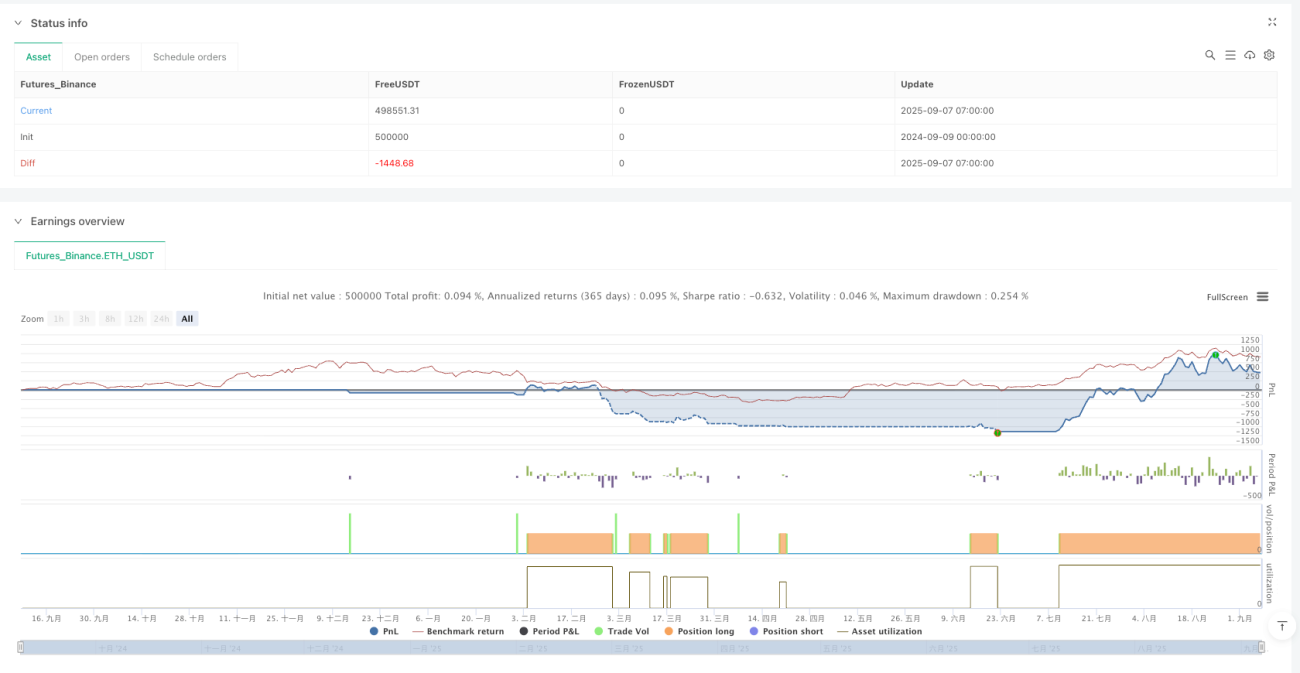
/*backtest
start: 2024-09-09 00:00:00
end: 2025-09-07 08:00:00
period: 1h
basePeriod: 1h
exchanges: [{"eid":"Futures_Binance","currency":"ETH_USDT","balance":500000}]
*/
//@version=6
strategy("Higher Lows, Lower Highs & Failures with Signal Quality Scoring", overlay=true)
// --- Higher Low detection ---
shares = 1
minScore = 4 // Minimum score to take trades
lowPoint = ta.lowest(low, 3)
prevLowPoint = ta.lowest(low[3], 3)
isHigherLow = low == lowPoint and low > prevLowPoint
bullConfirm = isHigherLow and close > open
// --- Lower High detection ---
highPoint = ta.highest(high, 3)
prevHighPoint = ta.highest(high[3], 3)
isLowerHigh = high == highPoint and high < prevHighPoint
bearConfirm = isLowerHigh and close < open
// --- Failures ---
failHigherLow = isHigherLow[1] and low < low[1]
failLowerHigh = isLowerHigh[1] and high > high[1]
// --- 2-in-a-row detection ---
bullSecond = bullConfirm and bullConfirm[1]
bearSecond = bearConfirm and bearConfirm[1]
// --- SIGNAL QUALITY SCORING (1-5 scale) ---
bullScore = if bullConfirm
score = 1 // Base score
// Factor 1: Volume confirmation
avgVolume = ta.sma(volume, 20)
if volume > avgVolume * 1.2
score := score + 1
// Factor 2: RSI positioning
rsi = ta.rsi(close, 14)
if rsi < 70 and rsi > 30
score := score + 1
// Factor 3: Candle strength
bodySize = math.abs(close - open)
candleRange = high - low
bodyRatio = candleRange > 0 ? bodySize / candleRange : 0
if bodyRatio > 0.6
score := score + 1
// Factor 4: Trend alignment
ma20 = ta.sma(close, 20)
ma50 = ta.sma(close, 50)
if ma20 > ma50 and close > ma20
score := score + 1
math.max(1, math.min(5, score))
else
na
bearScore = if bearConfirm
score = 1 // Base score
// Factor 1: Volume confirmation
avgVolume = ta.sma(volume, 20)
if volume > avgVolume * 1.2
score := score + 1
// Factor 2: RSI positioning
rsi = ta.rsi(close, 14)
if rsi > 30 and rsi < 70
score := score + 1
// Factor 3: Candle strength
bodySize = math.abs(close - open)
candleRange = high - low
bodyRatio = candleRange > 0 ? bodySize / candleRange : 0
if bodyRatio > 0.6
score := score + 1
// Factor 4: Trend alignment
ma20 = ta.sma(close, 20)
ma50 = ta.sma(close, 50)
if ma20 < ma50 and close < ma20
score := score + 1
math.max(1, math.min(5, score))
else
na
// --- Plot main signals with score-based styling ---
// Bullish signals
plotshape(bullConfirm and bullScore == 1, "Bull Score 1", shape.triangleup, location.belowbar, color.gray, size=size.tiny)
plotshape(bullConfirm and bullScore == 2, "Bull Score 2", shape.triangleup, location.belowbar, color.orange, size=size.small)
plotshape(bullConfirm and bullScore == 3, "Bull Score 3", shape.triangleup, location.belowbar, color.yellow, size=size.normal)
plotshape(bullConfirm and bullScore == 4, "Bull Score 4", shape.triangleup, location.belowbar, color.lime, size=size.normal)
plotshape(bullConfirm and bullScore == 5, "Bull Score 5", shape.triangleup, location.belowbar, color.green, size=size.large)
// Bearish signals
plotshape(bearConfirm and bearScore == 1, "Bear Score 1", shape.triangledown, location.abovebar, color.gray, size=size.tiny)
plotshape(bearConfirm and bearScore == 2, "Bear Score 2", shape.triangledown, location.abovebar, color.orange, size=size.small)
plotshape(bearConfirm and bearScore == 3, "Bear Score 3", shape.triangledown, location.abovebar, color.yellow, size=size.normal)
plotshape(bearConfirm and bearScore == 4, "Bear Score 4", shape.triangledown, location.abovebar, color.lime, size=size.normal)
plotshape(bearConfirm and bearScore == 5, "Bear Score 5", shape.triangledown, location.abovebar, color.green, size=size.large)
// --- Plot failures ---
plotshape(failHigherLow, "Failed Higher Low", shape.arrowdown, location.abovebar, color.red, size=size.small)
plotshape(failLowerHigh, "Failed Lower High", shape.arrowup, location.belowbar, color.green, size=size.small)
// --- Plot consecutive signals ---
plotshape(bullSecond, "Double Bullish Star", shape.diamond, location.bottom, color.lime, size=size.tiny)
plotshape(bearSecond, "Double Bearish Star", shape.diamond, location.top, color.red, size=size.tiny)
// --- Display score labels ---
if bullConfirm
labelColor = bullScore == 1 ? color.gray : bullScore == 2 ? color.orange : bullScore == 3 ? color.yellow : bullScore == 4 ? color.lime : color.green
label.new(bar_index, low - (high - low) * 0.1, "↑ " + str.tostring(bullScore), style=label.style_label_up, color=labelColor, textcolor=color.white, size=size.small)
if bearConfirm
labelColor = bearScore == 1 ? color.gray : bearScore == 2 ? color.orange : bearScore == 3 ? color.yellow : bearScore == 4 ? color.lime : color.green
label.new(bar_index, high + (high - low) * 0.1, "↓ " + str.tostring(bearScore), style=label.style_label_down, color=labelColor, textcolor=color.white, size=size.small)
// --- Alerts for high-quality signals only ---
alertcondition(bullConfirm and bullScore >= 4, "High Quality Bullish", "Strong Bullish Signal Detected")
alertcondition(bearConfirm and bearScore >= 4, "High Quality Bearish", "Strong Bearish Signal Detected")
// --- STRATEGY LOGIC ---
// Track previous highs and lows for stop levels
var float prevHigh = na
var float prevLow = na
// Update previous high/low when we get signals
if bullConfirm and bullScore >= minScore
prevLow := ta.lowest(low, 10) // Previous 10-bar low for stop
if bearConfirm and bearScore >= minScore
prevHigh := ta.highest(high, 10) // Previous 10-bar high for stop
// Entry conditions (only scores 4 or higher)
longCondition = bullConfirm and bullScore >= minScore
shortCondition = bearConfirm and bearScore >= minScore
// Execute trades
if longCondition and strategy.position_size == 0
strategy.entry("Long", strategy.long, qty=shares)
strategy.exit("Long Exit", "Long", stop=prevLow)
if shortCondition and strategy.position_size == 0
strategy.entry("Short", strategy.short, qty=shares)
strategy.exit("Short Exit", "Short", stop=prevHigh)
// Close opposite position if new signal occurs
if longCondition and strategy.position_size < 0
strategy.close("Short")
strategy.entry("Long", strategy.long, qty=shares)
strategy.exit("Long Exit", "Long", stop=prevLow)
if shortCondition and strategy.position_size > 0
strategy.close("Long")
strategy.entry("Short", strategy.short, qty=shares)
strategy.exit("Short Exit", "Short", stop=prevHigh)
// Plot stop levels for visualization
plot(strategy.position_size > 0 ? prevLow : na, "Long Stop", color.red, linewidth=2, style=plot.style_linebr)
plot(strategy.position_size < 0 ? prevHigh : na, "Short Stop", color.red, linewidth=2, style=plot.style_linebr)