
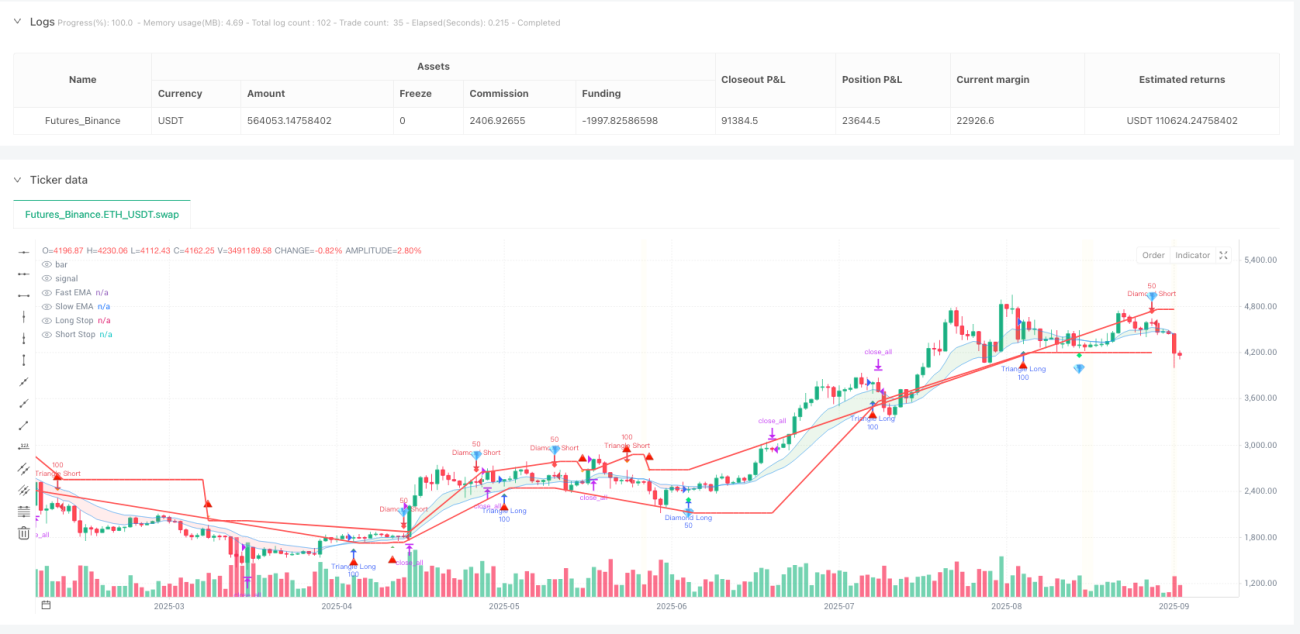
You know what? The market is actually like a giant geometric playground! This strategy simplifies complex price movements into three adorable shapes: 💎 diamonds represent reversal signals, 🔺 triangles represent trend continuation, and ⭕ circles represent choppy filters. It’s like putting “geometric glasses” on the market to instantly see the true intentions of price action!
The core logic is super simple: fast and slow EMAs form a cloud to determine the major trend, then based on price position relative to the cloud, different breakouts of highs and lows get different “labels.” Breakouts below the cloud are diamond reversal signals, breakouts above the cloud are triangle continuation signals, and those signals with insufficient EMA separation get marked as “noise” by circles and filtered out.
Diamond Signals💎: Specialized in catching reversal opportunities! Triggered when price shows higher lows below the EMA cloud, or lower highs above the cloud. It’s as obvious as finding gems in valleys or seeing warning lights on mountain peaks.
Triangle Signals🔺: Reliable assistants for trend continuation! Activated when price shows higher lows above the cloud, or lower highs below the cloud. Imagine surfing with the wave direction - naturally higher success rates.
Circle Filters⭕: Such a thoughtful design! When EMA separation is below the set threshold, all signals get marked as “choppy noise.” It’s like installing an “anti-shake function” for the strategy, avoiding frequent entries during sideways markets.
Stop loss logic uses previous key levels: long stops at previous lows, short stops at previous highs. The advantage is clear technical basis, avoiding random stops that get hit by “false breakouts.”
RSI exit mechanism is also smart: long positions close when RSI drops from above 70, short positions close when RSI bounces from below 30. This locks in profits while avoiding continued holding in extreme overbought/oversold zones.
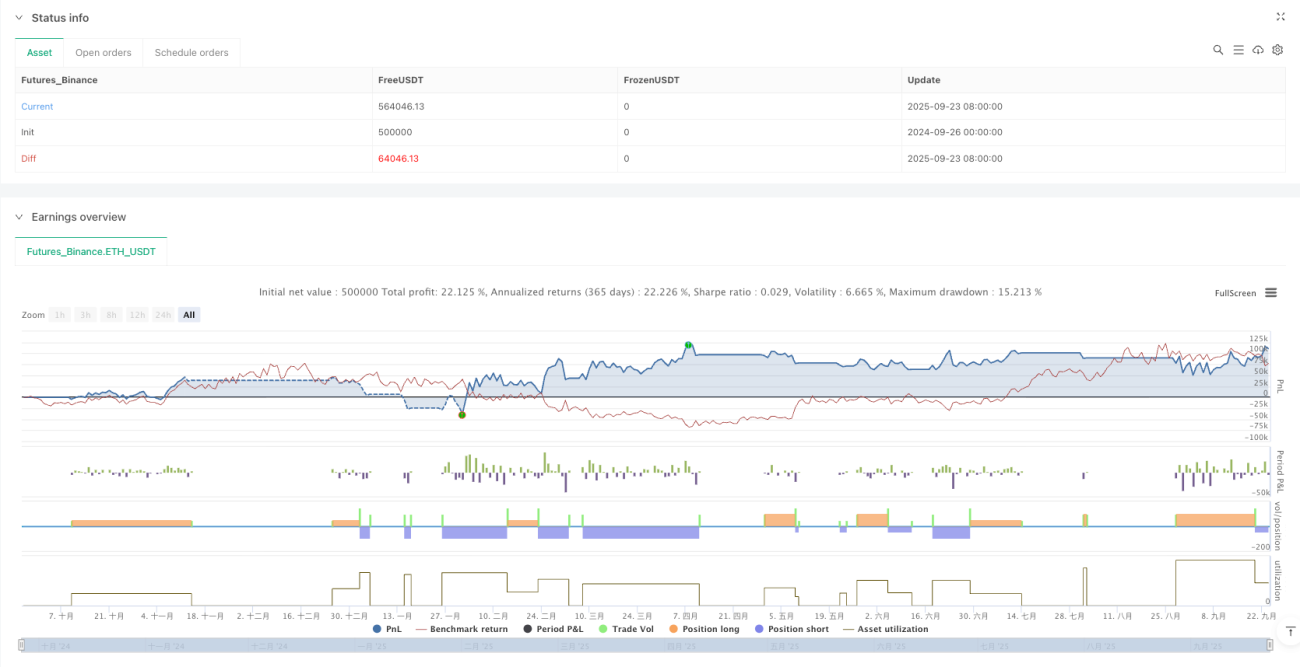
Best Scenarios: Medium to short-term trend following and reversal trading, especially excellent performance in moderately volatile market environments. The strategy automatically adjusts position sizes: 50% position for reversal signals as exploration, 100% position for continuation signals as follow-through.
Pitfall Guide: Never blindly use in extremely choppy markets! Although there’s circle filtering, signals become scarce during prolonged sideways action. Also, this strategy relies more on technical analysis - major fundamental news might make geometric shapes “ineffective.”
Remember, the best strategy isn’t the most complex one, but the one that best fits your trading style! 🎪
/*backtest
start: 2024-09-26 00:00:00
end: 2025-09-24 08:00:00
period: 1d
basePeriod: 1d
exchanges: [{"eid":"Futures_Binance","currency":"ETH_USDT","balance":500000}]
*/
//@version=5
strategy("💎🔺⚫ Diamond-Triangle-Circle Strategy", overlay=true)
// === INPUTS ===
ema_fast = input.int(10, "Fast EMA Length")
ema_slow = input.int(20, "Slow EMA Length")
min_ema_separation = input.float(0.1, "Min EMA Separation %", minval=0.01, maxval=1.0)
rsi_length = input.int(14, "RSI Length")
rsi_exit_level = input.int(70, "RSI Exit Level")
// === CALCULATIONS ===
ema_fast_val = ta.ema(close, ema_fast)
ema_slow_val = ta.ema(close, ema_slow)
rsi = ta.rsi(close, rsi_length)
// EMA Cloud and separation
cloud_bull = ema_fast_val > ema_slow_val
ema_separation_pct = math.abs(ema_fast_val - ema_slow_val) / close * 100
chop_filter = ema_separation_pct >= min_ema_separation
// Price position relative to cloud
price_above_cloud = close > math.max(ema_fast_val, ema_slow_val)
price_below_cloud = close < math.min(ema_fast_val, ema_slow_val)
// === HIGHER LOW DETECTION ===
lowPoint = ta.lowest(low, 3)
prevLowPoint = ta.lowest(low[3], 3)
isHigherLow = low == lowPoint and low > prevLowPoint
higherLowConfirmed = isHigherLow and close > open
// === LOWER HIGH DETECTION ===
highPoint = ta.highest(high, 3)
prevHighPoint = ta.highest(high[3], 3)
isLowerHigh = high == highPoint and high < prevHighPoint
lowerHighConfirmed = isLowerHigh and close < open
// === SIGNAL CLASSIFICATION ===
// Diamond Signal - Reversal (below cloud)
diamondBullish = higherLowConfirmed and price_below_cloud and chop_filter
diamondBearish = lowerHighConfirmed and price_above_cloud and chop_filter
// Triangle Signal - Continuation (above cloud)
triangleBullish = higherLowConfirmed and price_above_cloud and chop_filter
triangleBearish = lowerHighConfirmed and price_below_cloud and chop_filter
// Circle Signal - Chop (filtered out - display only)
chopBullish = higherLowConfirmed and not chop_filter
chopBearish = lowerHighConfirmed and not chop_filter
// === RSI EXIT LOGIC ===
rsi_was_above_70 = rsi[1] >= rsi_exit_level and rsi < rsi[1]
rsi_was_below_30 = rsi[1] <= (100 - rsi_exit_level) and rsi > rsi[1]
// === STOP LOSS LOGIC ===
var float long_stop = na
var float short_stop = na
if diamondBullish or triangleBullish
long_stop := prevLowPoint
if diamondBearish or triangleBearish
short_stop := prevHighPoint
// === STRATEGY EXECUTION ===
// Long Entries
if diamondBullish
strategy.entry("Diamond Long", strategy.long, qty=50, comment="💎 Reversal")
if triangleBullish
strategy.entry("Triangle Long", strategy.long, qty=100, comment="🔺 Continuation")
// Short Entries
if diamondBearish
strategy.entry("Diamond Short", strategy.short, qty=50, comment="💎 Reversal")
if triangleBearish
strategy.entry("Triangle Short", strategy.short, qty=100, comment="🔺 Continuation")
// === EXITS ===
// Long Exits
if strategy.position_size > 0
if close <= long_stop
strategy.close_all(comment="Stop Loss")
else if rsi_was_above_70
strategy.close_all(comment="RSI Exit")
// Short Exits
if strategy.position_size < 0
if close >= short_stop
strategy.close_all(comment="Stop Loss")
else if rsi_was_below_30
strategy.close_all(comment="RSI Exit")
// === VISUAL ELEMENTS ===
// EMA Cloud
ema1 = plot(ema_fast_val, "Fast EMA", color.new(color.blue, 60), linewidth=1)
ema2 = plot(ema_slow_val, "Slow EMA", color.new(color.blue, 60), linewidth=1)
fill(ema1, ema2, color=cloud_bull ? color.new(color.green, 85) : color.new(color.red, 85), title="EMA Cloud")
// Signal Shapes
plotshape(diamondBullish, "Diamond Long", shape.diamond, location.belowbar,
color.new(color.lime, 0), size=size.small, text="💎")
plotshape(diamondBearish, "Diamond Short", shape.diamond, location.abovebar,
color.new(color.red, 0), size=size.small, text="💎")
plotshape(triangleBullish, "Triangle Long", shape.triangleup, location.belowbar,
color.new(color.green, 20), size=size.small, text="🔺")
plotshape(triangleBearish, "Triangle Short", shape.triangledown, location.abovebar,
color.new(color.orange, 20), size=size.small, text="🔺")
plotshape(chopBullish, "Chop Long", shape.circle, location.belowbar,
color.new(color.gray, 50), size=size.tiny, text="⚫")
plotshape(chopBearish, "Chop Short", shape.circle, location.abovebar,
color.new(color.gray, 50), size=size.tiny, text="⚫")
// Stop Loss Lines
plot(strategy.position_size > 0 ? long_stop : na, "Long Stop", color.red, linewidth=2)
plot(strategy.position_size < 0 ? short_stop : na, "Short Stop", color.red, linewidth=2)
// Background coloring for market conditions
bgcolor(not chop_filter ? color.new(color.yellow, 95) : na, title="Chop Zone")
// === ALERTS ===
alertcondition(diamondBullish, title="Diamond Long Signal", message="💎 REVERSAL LONG - {{ticker}} at {{close}}")
alertcondition(diamondBearish, title="Diamond Short Signal", message="💎 REVERSAL SHORT - {{ticker}} at {{close}}")
alertcondition(triangleBullish, title="Triangle Long Signal", message="🔺 CONTINUATION LONG - {{ticker}} at {{close}}")
alertcondition(triangleBearish, title="Triangle Short Signal", message="🔺 CONTINUATION SHORT - {{ticker}} at {{close}}")
alertcondition(strategy.position_size == 0 and strategy.position_size[1] != 0, title="Position Closed", message="💰 POSITION CLOSED - {{ticker}} at {{close}}")