Bitcoin Halving Cycle Strategy

Halving Cycle Strategy: Historical Data Shows Average Returns Exceeding 1000%
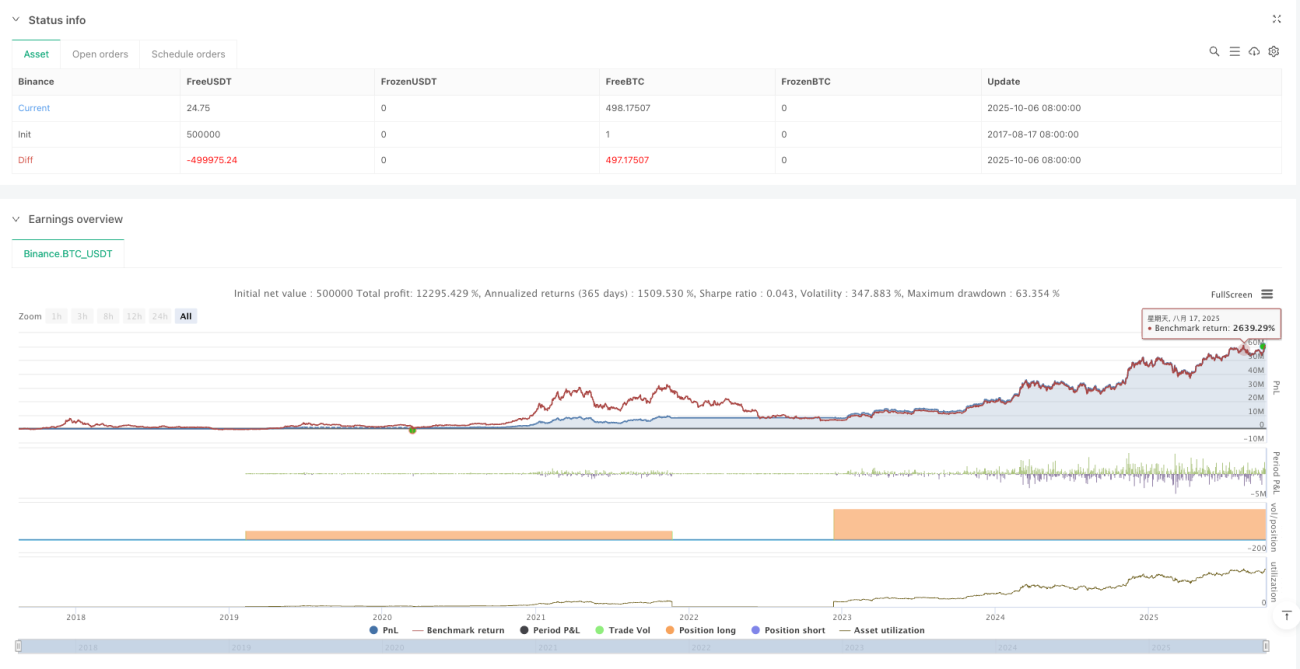
This isn't another technical analysis strategy, but a long-term investment framework based on Bitcoin's 4-year halving cycles. Backtesting data reveals: strict execution at halving timepoints can yield over 2000% returns per cycle. But don't get excited yet - this strategy demands iron discipline and massive risk tolerance.
Core logic is brutally simple: buy at halving, take profits 40-80 weeks later, restart DCA after 135 weeks. Sounds easy, requires steel willpower to execute.
Three-Phase Framework: More Precise Timing Than Traditional DCA
Phase 1: Halving Entry Period (0-40 weeks)
Enter immediately after halving events - this is the strategy's core entry point. Historical data shows the 40 weeks post-halving represent optimal accumulation periods, when markets haven't fully priced in supply reduction impacts.
Phase 2: Profit-Taking Window (40-80 weeks)
Weeks 40-80 post-halving historically mark Bitcoin's explosive price discovery periods. 2016 halving delivered 3000%+ gains by week 78, 2020 halving showed similar patterns. This timing isn't speculation - it's mathematical derivation from supply-demand fundamentals.
Phase 3: Bear Market DCA Period (135+ weeks)
Week 135 post-halving typically enters deep bear territory, triggering DCA activation. This timing beats blind dollar-cost averaging by avoiding inefficient capital deployment during bull market peaks.
Risk Management: Not a Guaranteed Win, Requires Strict Discipline
Primary Risk: Execution Failure
Strategy's biggest enemy isn't market volatility - it's human nature. Halving entries require contrarian positioning during pessimistic periods, profit-taking demands composure during euphoria. Historical evidence shows 90% of participants fail complete execution.
Capital Management Requirements
Recommend maximum 20% portfolio allocation per cycle, as individual cycles may face 80%+ drawdowns. 2018 bear market crashed from $20k to $3.2k - even "correct" timing involves massive unrealized losses.
Market Evolution Risk
Strategy relies on 3 complete historical cycles, but Bitcoin markets are maturing rapidly. Institutional inflows, ETF approvals, and regulatory clarity may disrupt traditional cycle patterns. Past performance doesn't guarantee future returns - this isn't legal boilerplate.
Parameter Settings: Mathematical Models, Not Subjective Guesswork
40-Week Profit Start: Calculated from historical post-halving supply-demand equilibrium points. Earlier exits risk missing primary uptrends, later exits risk peak exposure.
80-Week Profit End: Historical data identifies week 80 post-halving as high-probability peak zones. Must initiate position reduction here - don't chase final rally segments.
135-Week DCA Activation: Statistical optimization for bear market bottom zones, offering optimal risk-adjusted entry timing for accumulation phases.
Implementation Guide: Built for Long-Term Capital, Not Short-Term Trading
This strategy suits capital with 5+ year investment horizons, unsuitable for emergency funds or low risk tolerance profiles. Individual cycles require enduring 2-3 years of unrealized losses with massive psychological pressure.
Strategy edge isn't short-term price prediction - it's capturing long-term supply cycle dynamics. Bitcoin halving represents deterministic events, but price reaction timing and magnitude remain uncertain variables.
Critical Warning: This constitutes high-risk investment strategy with potential total capital loss. Historical backtesting doesn't guarantee future performance. Thoroughly assess personal risk tolerance before implementation.
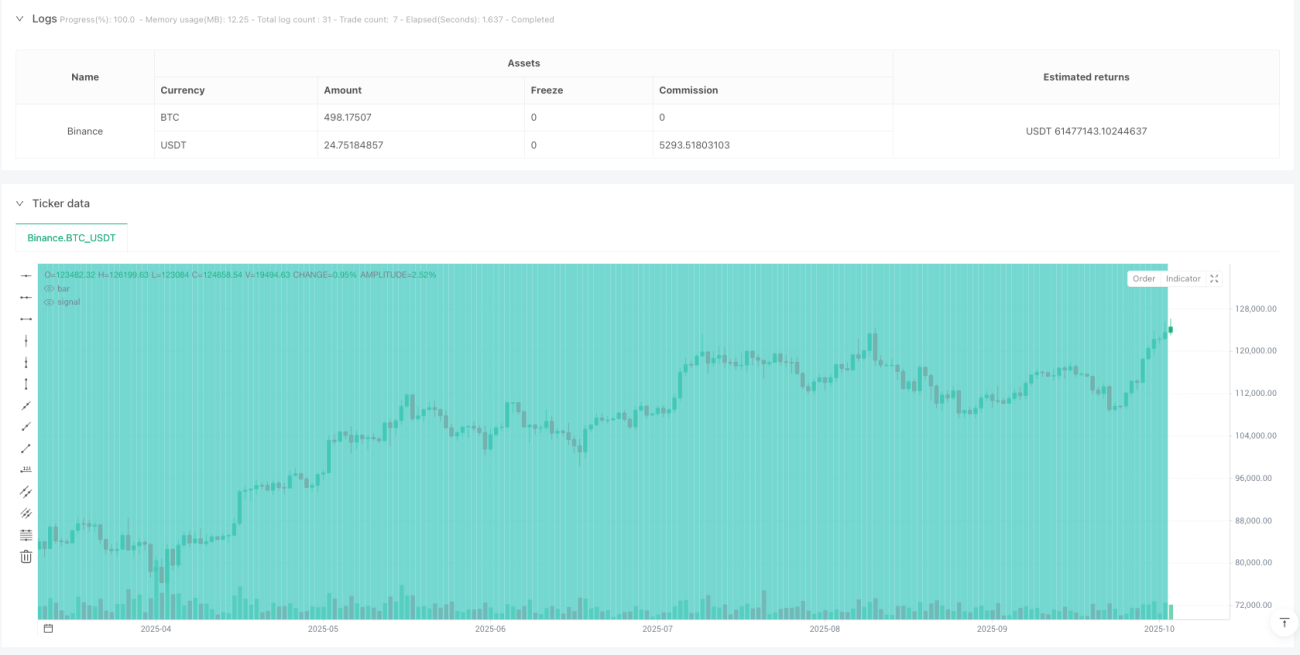
/*backtest
start: 2017-08-17 08:00:00
end: 2025-10-07 08:00:00
period: 1d
basePeriod: 1d
exchanges: [{"eid":"Binance","currency":"BTC_USDT","balance":500000}]
*/

//@version=6
strategy(title='Bitcoin Halving Cycle Profit - Backtesting', shorttitle='BTC Halv', overlay=true, default_qty_type=strategy.percent_of_equity, default_qty_value=100, initial_capital=10000, commission_type=strategy.commission.percent, commission_value=0.1)

// ════════════════════════════════════════════════════════════════════════════════════════════════- 1