Heiken Ashi Balance Strategy: The Perfect Dance Between Candles and Clouds

HEIKEN ASHI ICHIMOKU EMA ATR
Created on: 2025-10-20 13:19:44 Modified on: 2025-10-20 13:19:44
Copy: 0 Number of hits: 136
avatar of ianzeng123 ianzeng123
2
Follow
329
Followers

 Heiken Ashi Balance Strategy: The Perfect Dance Between Candles and Clouds  Heiken Ashi Balance Strategy: The Perfect Dance Between Candles and Clouds

🎯 What’s This Strategy Really About?

You know what? This strategy is like making candlesticks dance on a balance beam! It transforms regular candlestick charts into smoother Heiken Ashi candles, then pairs them with Ichimoku’s baseline - it’s basically the “pairs figure skating” of technical analysis. Key point! This isn’t rocket science, but rather a smart way to filter out market noise and see the real trend direction clearly.

🔍 Core Logic: The Wisdom of Triple Filtering

The essence of this strategy lies in its “triple filtering system” - as strict as choosing your life partner! First, Heiken Ashi candles must be on the correct side of the Ichimoku baseline (basic requirement); second, the 200-period EMA ensures you’re following the major trend (don’t swim against the current); finally, the Ichimoku divergence filter confirms momentum direction (avoiding false breakout traps).

It’s like driving: green light is on (HA signal), road conditions are good (trend filter), and no oncoming traffic (divergence confirmation). Only when all three conditions align will it generate a trading signal!

💡 Risk Management: ATR Dynamic TP/SL

Here’s your pitfall guide! The smartest feature of this strategy is using ATR (Average True Range) for stop-loss and take-profit levels. It automatically adjusts based on market volatility, like a car’s adaptive cruise control. When market volatility is high, stop-loss distances widen automatically; when volatility is low, stops tighten up.

Even better, it uses multi-timeframe approach: higher timeframe ATR for take-profits (letting profits run), and lower timeframe ATR for stop-losses (quick protection of capital). This design is absolutely brilliant!

🚀 Practical Application: When to Use It Best?

This strategy excels in trending market environments. During sideways consolidation, it’s better to stay on the sidelines since Heiken Ashi can produce false signals in choppy markets. Optimal use cases: major currency pairs on 4-hour or daily charts, especially during trend confirmation phases after important economic data releases.

Remember, no strategy is perfect! This strategy’s strength is capturing medium to long-term trends. If you’re a scalper who loves quick in-and-out trades, you might need to adjust parameters or look for other strategies.
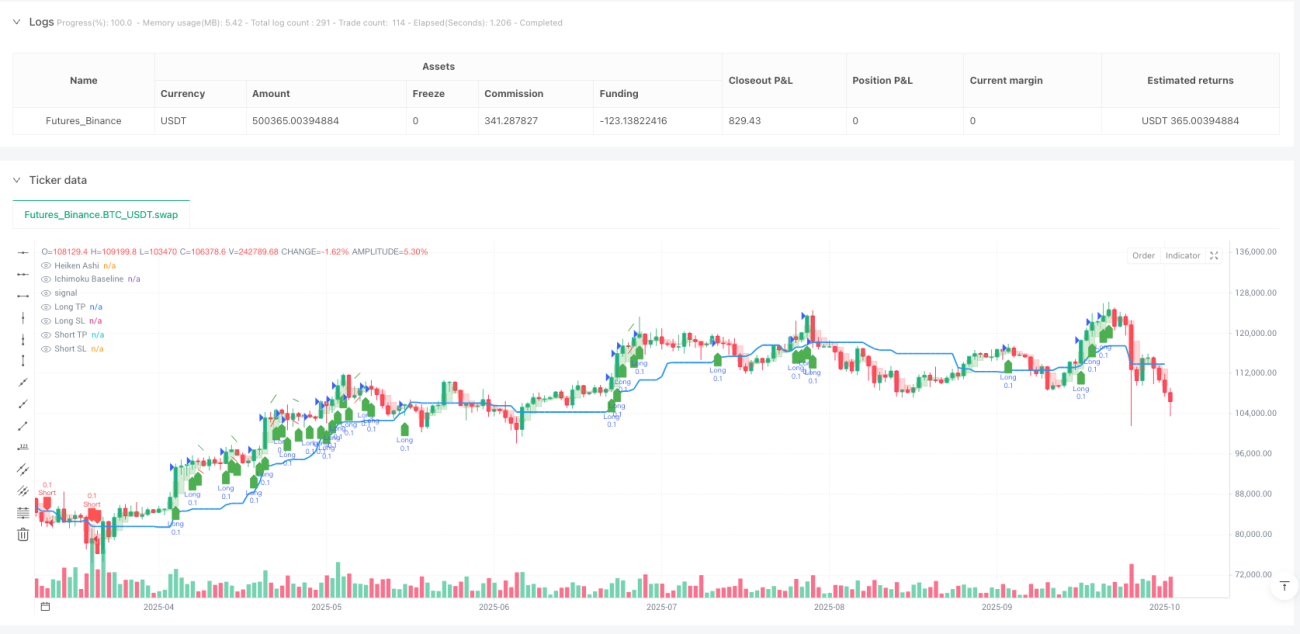
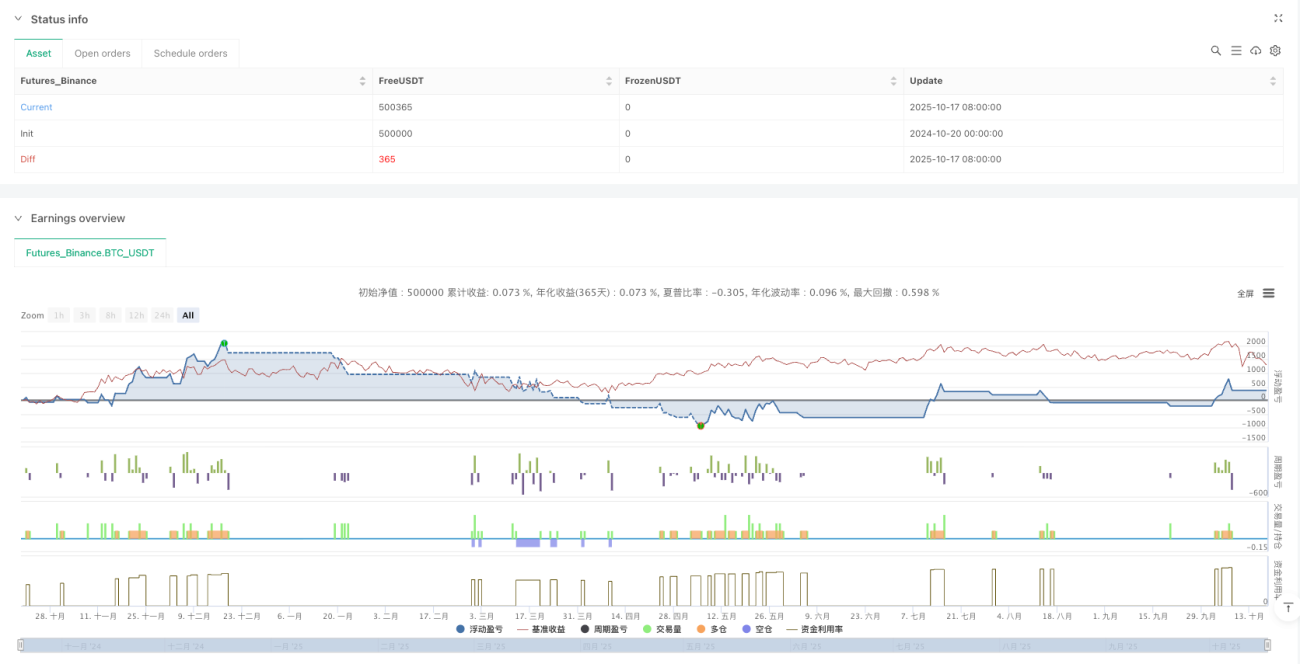
Strategy source code
/*backtest
start: 2024-10-20 00:00:00
end: 2025-10-18 08:00:00
period: 1d
basePeriod: 1d
exchanges: [{"eid":"Futures_Binance","currency":"BTC_USDT","balance":500000}]
*/

// This Pine ScriptÂź code is subject to the terms of the Mozilla Public License 2.0 at https://mozilla.org/MPL/2.0/
// © MahdiSalari8
//@version=6
strategy("Heiken Ashi Bas", overlay=true, 
     default_qty_type=strategy.fixed, 
     default_qty_value=0.1, 
     commission_type=strategy.commission.percent, 
     commission_value=0.07,
     initial_capital=10000000,
     pyramiding=0)  // Changed to 0

// Inputs
useTrendFilter = input.bool(true, "Use 200 EMA Trend Filter", group="Filters")
showSignals = input.bool(true, "Show Buy/Sell Signals", group="Visuals")
showEma = input.bool(false, "Show 200 EMA", group="Visuals")
atrPeriod = input.int(14, "ATR Period", minval=1, group="Risk Management")
htf = input.timeframe("5", "Higher Timeframe for TP", group="Timeframes")
ltf = input.timeframe("1", "Lower Timeframe for SL", group="Timeframes")
tpMultiplier = input.float(2.0, "TP Multiplier", minval=0.1, group="Risk Management")
slMultiplier = input.float(1.0, "SL Multiplier", minval=0.1, group="Risk Management")

// Ichimoku Divergence Settings
useDivergenceFilter = input.bool(true, "Use Ichimoku Divergence Filter", group="Ichimoku Divergence")
showDivergenceLine = input.bool(true, "Show Divergence Line", group="Ichimoku Divergence")
divergenceLookback = input.int(2, "Divergence Lookback (bars)", minval=1, maxval=20, group="Ichimoku Divergence")
divergenceLineWidth = input.int(5, "Divergence Line Width", minval=1, maxval=5, group="Ichimoku Divergence")

// Heiken Ashi Calculation
var float haOpen = na
var float haClose = na
var float haHigh = na
var float haLow = na

haClose := (open + high + low + close) / 4
haOpen := na(haOpen[1]) ? (open + close) / 2 : (haOpen[1] + haClose[1]) / 2
haHigh := math.max(high, math.max(haOpen, haClose))
haLow := math.min(low, math.min(haOpen, haClose))

// Ichimoku Baseline (Kijun-sen)
kijunPeriod = 26
kijunSen = (ta.highest(high, kijunPeriod) + ta.lowest(low, kijunPeriod)) / 2

// Ichimoku Baseline Divergence Calculation
currentBaseline = kijunSen
pastBaseline = kijunSen[divergenceLookback]

// Calculate slope (divergence)
baselineSlope = (currentBaseline - pastBaseline) / divergenceLookback

// Determine bullish/bearish divergence (exclude when slope is 0)
bullishDivergence = baselineSlope > 0
bearishDivergence = baselineSlope < 0
slopeIsZero = baselineSlope == 0

// Trend Filter (200 EMA)
ema200 = ta.ema(close, 200)

// ATR Calculation for different timeframes
htfAtr = request.security(syminfo.tickerid, htf, ta.atr(atrPeriod))
ltfAtr = request.security(syminfo.tickerid, ltf, ta.atr(atrPeriod))

// Enhanced Entry Conditions with Divergence Filter (exclude when slope is 0)
longCondition = haClose > kijunSen and 
              haClose[1] >= kijunSen[1] and 
              haClose > haOpen and 
              (haHigh - haClose) >= (haClose - haOpen) * 0.3 and 
              (not useTrendFilter or close > ema200) and
              (not useDivergenceFilter or (bullishDivergence and not slopeIsZero))

shortCondition = haClose < kijunSen and 
               haClose[1] <= kijunSen[1] and 
               haClose < haOpen and 
               (haClose - haLow) >= (haOpen - haClose) * 0.3 and 
               (not useTrendFilter or close < ema200) and
              (not useDivergenceFilter or (bearishDivergence and not slopeIsZero))

// Dynamic TP/SL based on ATR
longTp = close + (htfAtr * tpMultiplier)
longSl = close - (ltfAtr * slMultiplier)
shortTp = close - (htfAtr * tpMultiplier)
shortSl = close + (ltfAtr * slMultiplier)

// Strategy Execution
if (longCondition)
    strategy.entry("Long", strategy.long)
    strategy.exit("Long Exit", "Long", limit=longTp, stop=longSl)

if (shortCondition)
    strategy.entry("Short", strategy.short)
    strategy.exit("Short Exit", "Short", limit=shortTp, stop=shortSl)

// Plotting
plot(kijunSen, color=color.blue, title="Ichimoku Baseline", linewidth=2, display=display.all)

// Plot Divergence Line (gray when slope is 0)

plot(showEma ? ema200 : na, color=color.purple, title="200 EMA", linewidth=1, display=display.all)

// Heiken Ashi Candles with 25% opacity
candleColor = haClose > haOpen ? color.new(color.green, 75) : color.new(color.red, 75)
plotcandle(haOpen, haHigh, haLow, haClose, title="Heiken Ashi", color=candleColor, wickcolor=candleColor, bordercolor=candleColor, display=display.all)

// Plot Buy/Sell Signals with labelup/labeldown shapes
plotshape(showSignals and longCondition, style=shape.labelup, location=location.belowbar, color=color.new(color.green, 0), size=size.small, title="Buy Signal", display=display.all)
plotshape(showSignals and shortCondition, style=shape.labeldown, location=location.abovebar, color=color.new(color.red, 0), size=size.small, title="Sell Signal", display=display.all)

// Plot TP/SL levels - TP as lines with breaks, SL hidden by default
plot(strategy.position_size > 0 ? longTp : na, "Long TP", color=color.green, style=plot.style_linebr, linewidth=1, display=display.all)
plot(strategy.position_size > 0 ? longSl : na, "Long SL", color=color.red, style=plot.style_linebr, linewidth=1, display=display.none)
plot(strategy.position_size < 0 ? shortTp : na, "Short TP", color=color.green, style=plot.style_linebr, linewidth=1, display=display.all)
plot(strategy.position_size < 0 ? shortSl : na, "Short SL", color=color.red, style=plot.style_linebr, linewidth=1, display=display.none)

// Alerts
alertcondition(longCondition, "Long Signal", "HA Cross Above Kijun-sen with Bullish Divergence")
alertcondition(shortCondition, "Short Signal", "HA Cross Below Kijun-sen with Bearish Divergence")