Neurodoc Trading Bot

EMA BB MACD RSI DCA
Created on: 2025-10-20 15:48:05 Modified on: 2025-10-20 15:48:05
Copy: 0 Number of hits: 216
avatar of ianzeng123 ianzeng123
2
Follow
329
Followers

Neurodoc Trading Bot Neurodoc Trading Bot

This Isn’t Your Average DCA Strategy—It’s a Thinking Trading Bot

After reviewing thousands of Pine Script codes, this “Master Trading Bot” genuinely has some serious chops. The author has elevated DCA (Dollar Cost Averaging) to new heights: instead of mindless averaging down, it’s an intelligent position-sizing system based on technical indicators. Starting with 5% position size, incrementing by 2.5% per DCA, capped at 100%. This progressive capital management approach is more scientific than traditional equal-amount averaging.

The key lies in DCA trigger conditions: price must drop below average cost AND meet a dynamic threshold of 2% + step×4%. First DCA requires 2% drop, second needs 6%, third needs 10%. This design prevents frequent averaging in minor fluctuations, only adding positions during genuine pullbacks.

Multiple Technical Indicators Combined, Yet Logic Remains Clear

The strategy uses 3/7/18 period EMAs for trend framework, combined with 20-period Bollinger Bands for price positioning, 52/200/3 MACD parameters favoring medium-to-long-term signals, and 14-period RSI for overbought/oversold conditions. This combination covers trend, momentum, and volatility—more reliable than single-indicator strategies.

Entry conditions are strict: Fast EMA > Slow EMA + MACD golden cross + price above BB middle + RSI < 65. All four conditions must align for entry, filtering out most false signals. Exit conditions are equally rigorous: minimum 2% profit + trend weakening + MACD death cross. This “profit-first exit” design avoids meaningless stop losses.

100% Stop Loss Seems Aggressive, But Actually Reasonable

The 100% stop loss in the code looks extreme, but the comment clarifies: “price would have to go to 0 to trigger.” This effectively disables traditional stop losses, relying entirely on technical indicators and profit targets for risk management. For DCA strategies, this design makes sense—if you’re adding on dips, traditional stops become counterproductive.

Real risk control comes from: 2% price drop signals + dynamic DCA thresholds + mandatory profitable exits. The strategy tracks highest price over 500 periods, triggering sell signals when current price drops 2% from peaks. This is more flexible than fixed stops, adapting to different market environments.

Capital Management Is This Strategy’s Core Competitive Edge

Each buy amount = current equity × DCA percentage ÷ current price. This equity-based rather than fixed-amount approach allows the strategy to scale positions as the account grows. Initial 5% position controls single-trade risk, while progressive sizing ensures sufficient firepower for real opportunities.

Most ingenious is the “just_sold” state management: no immediate re-entry after selling unless strong bullish signals emerge. This prevents frequent trading in choppy markets, reducing commission costs and emotional trading risks.

Clear Use Cases—Not a Universal Strategy

This strategy works best for buying pullbacks within medium-to-long-term uptrends, performing poorly in bear markets or extended sideways action. The MACD 52200 parameters favor larger timeframe trend identification, unsuitable for scalping.

RSI oversold threshold at 25 instead of 30 indicates preference for deeper pullback entries. This design captures better entry points in bull markets but risks “catching falling knives” in bear markets. Recommend using during clear uptrends, avoiding activation at market tops or downtrends.

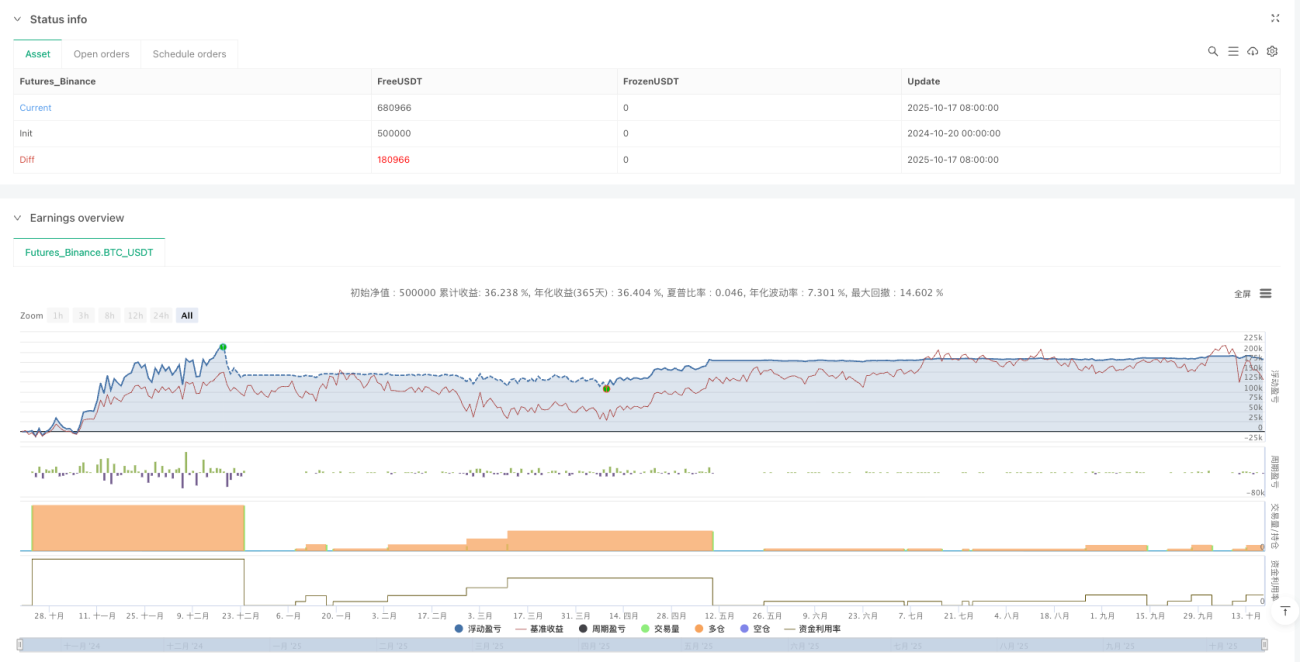
Backtest Performance Requires Focus on Maximum Drawdown and Consecutive Losses

The strategy’s theoretical logic is sound, but actual performance depends on specific backtest data. Key metrics to monitor: maximum drawdown within acceptable ranges, consecutive loss frequency, performance variations across market environments.

DCA strategies naturally add positions during declines, meaning account equity drops before rising. Investors need sufficient psychological tolerance and capital reserves. Recommend testing with small capital first, confirming strategy characteristics before scaling up investment size.

Risk Warning: All quantitative strategies carry loss risks. Historical backtests don’t guarantee future returns. Strict risk management and appropriate capital allocation are essential.
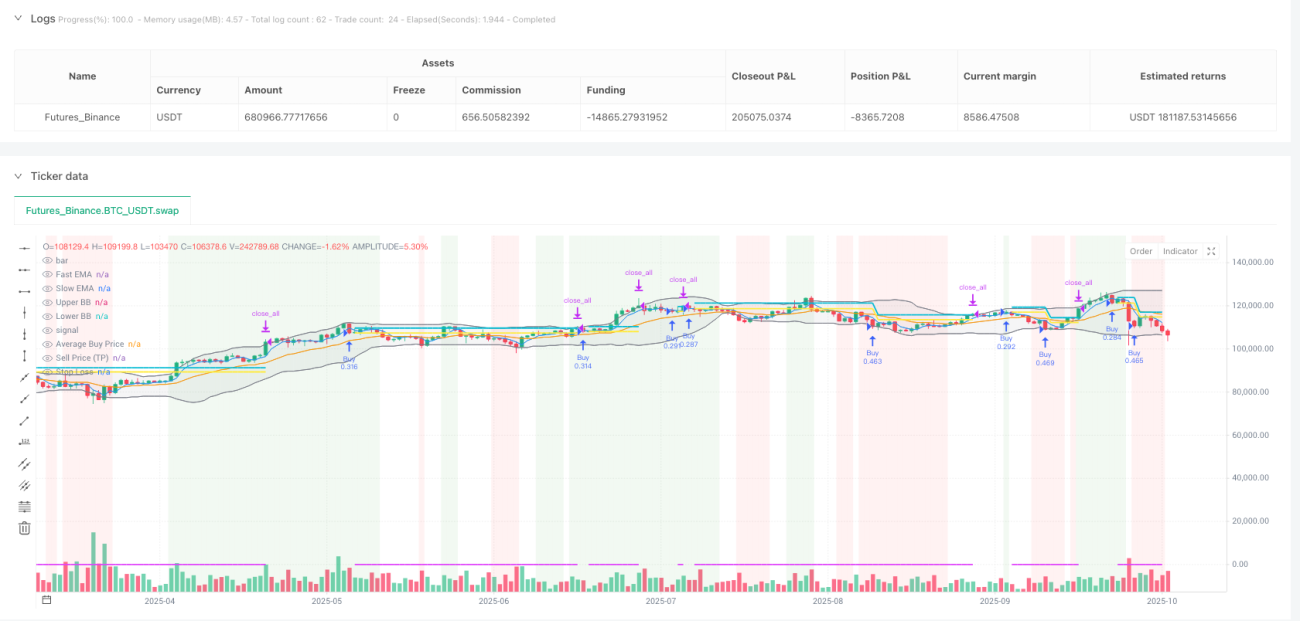
Strategy source code
/*backtest
start: 2024-10-20 00:00:00
end: 2025-10-18 08:00:00
period: 1d
basePeriod: 1d
exchanges: [{"eid":"Futures_Binance","currency":"BTC_USDT","balance":500000}]
*/

// This Pine Script™ code is subject to the terms of the MPL 2.0 at https://mozilla.org/MPL/2.0/
// © MTB by Neurodoc
// By Nicolás Astorga

//@version=5
strategy("Master Trading Bot by Neurodoc", 
         shorttitle="MTB Adaptation", 
         overlay=true, 
         initial_capital=10000, 
         pyramiding=100,
         commission_value=0.1, 
         commission_type=strategy.commission.percent,
         default_qty_type = strategy.cash)

// —————— CONFIGURATION (Based on ve.env) ——————
// Purchase and DCA Percentages
var GRP_DCA = "DCA Configuration"
start_percentage = input.float(5.0, "Initial Buy Percentage (%)", group=GRP_DCA)
increment_percentage = input.float(2.5, "Increment per DCA Buy (%)", group=GRP_DCA)
max_percentage = input.float(100.0, "Maximum Buy Percentage (%)", group=GRP_DCA)
min_profit_percent = input.float(2.0, "Minimum Profit for Sell (%)", group=GRP_DCA)

// Stop Loss and Drop Signal
var GRP_RISK = "Risk Management"
stop_loss_percent = input.float(100.0, "Stop Loss (%)", group=GRP_RISK, tooltip="A value of 100 means there’s no real stop loss, as price would have to go to 0.")
drop_percent_signal = input.float(2.0, "Price Drop for Sell Signal (%)", group=GRP_RISK)

// Indicator Parameters
var GRP_INDICATORS = "Indicator Parameters"
ema_fast_period = input.int(3, "Fast EMA", group=GRP_INDICATORS)
ema_mid_period = input.int(7, "Medium EMA", group=GRP_INDICATORS)
ema_slow_period = input.int(18, "Slow EMA", group=GRP_INDICATORS)
bb_length = input.int(20, "Bollinger Bands Length", group=GRP_INDICATORS)
bb_stddev = input.float(2.0, "BB Standard Deviation", group=GRP_INDICATORS)
macd_fast = input.int(52, "MACD Fast", group=GRP_INDICATORS)
macd_slow = input.int(200, "MACD Slow", group=GRP_INDICATORS)
macd_signal = input.int(3, "MACD Signal", group=GRP_INDICATORS)
rsi_length = input.int(14, "RSI Length", group=GRP_INDICATORS)
rsi_oversold_threshold = input.int(25, "RSI Oversold (for divergence)", group=GRP_INDICATORS)

// —————— INDICATOR CALCULATIONS ——————
// EMAs
ema_fast = ta.ema(open, ema_fast_period)
ema_mid = ta.ema(open, ema_mid_period)
ema_slow = ta.ema(open, ema_slow_period)

// Bollinger Bands
[bb_middle, bb_upper, bb_lower] = ta.bb(close, bb_length, bb_stddev)
bb_width = (bb_upper - bb_lower) / bb_middle * 100
is_bb_expanding = bb_width > bb_width[1]

// MACD
[macd_line, signal_line, _] = ta.macd(close, macd_fast, macd_slow, macd_signal)

// RSI
rsi = ta.rsi(close, rsi_length)

// Price drop signal from highest price (similar to `cummax` in Python)
highest_price = ta.highest(high, 500) // Using 500-bar lookback to approximate the high
price_drop_percent = ((highest_price - close) / highest_price) * 100
is_price_drop_signal = price_drop_percent >= drop_percent_signal

// —————— TRADING LOGIC ——————
// Trend Conditions
is_bullish = ema_fast > ema_slow and macd_line > signal_line and close > bb_middle
is_bearish = ema_fast < ema_slow and macd_line < signal_line and close < bb_middle
is_weakening = rsi < rsi[1]

// Variables to manage strategy state
var bool just_sold = false
var int dca_step = 0

// Determine next buy percentage of capital
dca_buy_percentage = start_percentage + (dca_step * increment_percentage)
if dca_buy_percentage > max_percentage
    dca_buy_percentage := max_percentage

avg_buy_price = strategy.position_avg_price

// Initial Long Condition
long_signal_initial = strategy.position_size == 0 and is_bullish and macd_line > signal_line and rsi < 65

// DCA Condition
price_drop_from_avg = ((avg_buy_price - close) / avg_buy_price) * 100
dca_required_drop = 2.0 + (dca_step * 4.0) // DCA price drop start and increment logic
long_signal_dca = strategy.position_size > 0 and is_bearish and close < avg_buy_price and price_drop_from_avg >= dca_required_drop

// Manage `just_sold` state
if strategy.position_size > 0
    just_sold := false
if strategy.position_size == 0 and strategy.position_size[1] > 0
    just_sold := true

// Avoid immediate repurchase after sell unless bullish condition is strong
long_signal = (just_sold and is_bullish) ? long_signal_initial : (not just_sold ? (long_signal_initial or long_signal_dca) : false)

// Sell (Close) Condition
current_profit_percent = ((close - avg_buy_price) / avg_buy_price) * 100
has_min_profit = current_profit_percent >= min_profit_percent
stop_loss_price = avg_buy_price * (1 - stop_loss_percent / 100)
is_stoploss_triggered = close <= stop_loss_price

short_signal = strategy.position_size > 0 and has_min_profit and ((is_bearish and is_weakening) or is_price_drop_signal or is_stoploss_triggered or (macd_line < signal_line))

// —————— ORDER EXECUTION ——————
if (long_signal)
    // Calculate how much MONEY (USDT) to invest in this trade
    cash_to_invest = (strategy.equity * dca_buy_percentage / 100) / close
    strategy.entry("Buy", strategy.long, qty=cash_to_invest)
    dca_step := dca_step + 1
        
if (short_signal)
    strategy.close_all(comment="Sell")
    dca_step := 0 // Reset DCA counter after selling

// —————— VISUALIZATION ——————
// Background color by trend
bgcolor(is_bullish ? color.new(color.green, 90) : is_bearish ? color.new(color.red, 90) : na)

// Plot EMAs and Bollinger Bands
plot(ema_fast, "Fast EMA", color.blue)
plot(ema_slow, "Slow EMA", color.orange)
p1 = plot(bb_upper, "Upper BB", color=color.gray)
p2 = plot(bb_lower, "Lower BB", color=color.gray)
fill(p1, p2, color=color.new(color.gray, 90))

// Plot average buy price when in position
plot(strategy.position_size > 0 ? avg_buy_price : na, "Average Buy Price", color.yellow, style=plot.style_linebr, linewidth=2)

// Plot Take Profit target
plot(strategy.position_size > 0 ? avg_buy_price * (1 + min_profit_percent / 100) : na, "Sell Price (TP)", color.aqua, style=plot.style_linebr, linewidth=2)

// Plot Stop Loss level
plot(strategy.position_size > 0 ? stop_loss_price : na, "Stop Loss", color.fuchsia, style=plot.style_linebr, linewidth=2)