Gold Liquidity Hunter Strategy

EMA Pivot ATR Liquidity Sweep
Created on: 2025-11-06 11:42:28 Modified on: 2025-11-06 11:42:28
Copy: 0 Number of hits: 198
avatar of ianzeng123 ianzeng123
2
Follow
319
Followers

 Gold Liquidity Hunter Strategy  Gold Liquidity Hunter Strategy

🎯 What’s This Strategy Really Doing?

You know what? There’s a group of “smart money” in the market that loves setting traps at key levels! This strategy works like an experienced hunter, specifically identifying these traps and trading in reverse. Simply put, when price deliberately “fakes out” important support/resistance levels and quickly snaps back, we follow the big money’s rhythm!

📊 Triple Filter System Revealed

Key point! This strategy uses three layers of protection:

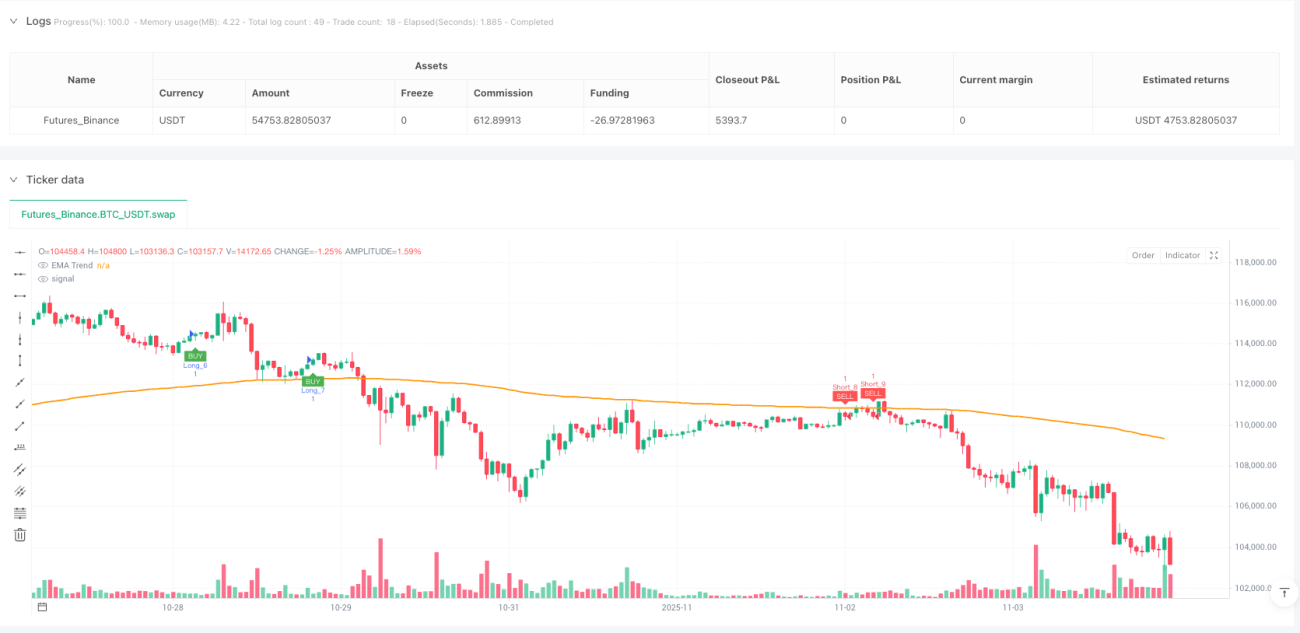
🔸 Trend Filter: 200-period EMA acts like an experienced driver, telling you whether you’re on an uphill or downhill road 🔸 Key Level Identification: Automatically finds those “strategically important” support and resistance zones
🔸 Liquidity Sweep Detection: Catches the deliberate “fake moves” created by big money

It’s like fishing - you need to know where the fish are, what bait to use, and when to reel in!

🎪 The Magic of Liquidity Sweeps

Imagine this: you’re queuing for bubble tea when someone suddenly shouts “Free drinks!” Everyone rushes over, only to find it’s fake, but smart people have already cut to the front of the line.

Markets work the same way! Price first “pretends” to break below support (sweeping stop losses), then quickly recovers - that’s the perfect entry moment. The strategy sets a 0.6x ATR buffer to ensure it’s truly a “sweep” and not a real breakout.

⚡ Risk Control: The Golden 1:2 Ratio

Pitfall Guide: Many traders are like driving without seatbelts - this strategy enforces a mandatory 1:2 risk-reward ratio!

  • Stop loss set 0.5x ATR below key levels
  • Take profit is 2x the stop loss distance
  • Even with just 40% win rate, you’ll profit long-term!

🚀 Practical Application Tips

This strategy works best on 15-minute gold charts. Why? Because gold markets have good liquidity, obvious fake breakout patterns, and the 15-minute timeframe filters out excessive noise.

Remember: don’t be greedy! The strategy finds you good positions - leave the rest to the market and time!
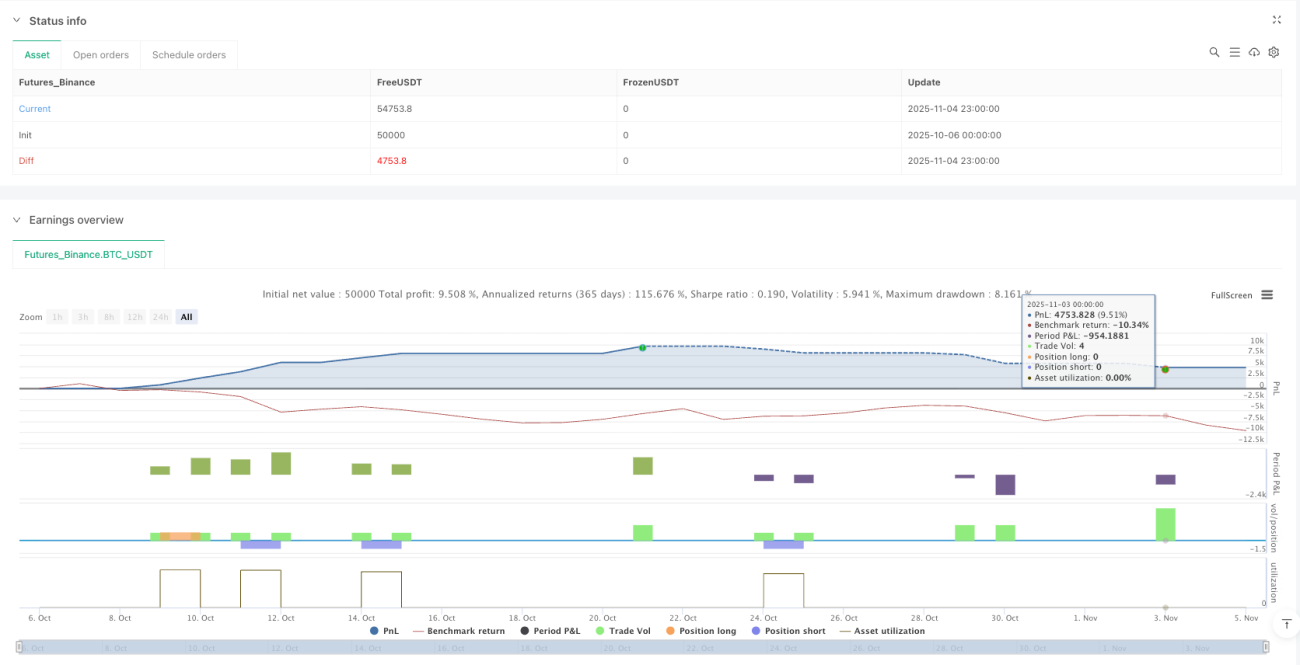
Strategy source code
/*backtest
start: 2025-10-06 00:00:00
end: 2025-11-05 00:00:00
period: 1h
basePeriod: 1h
exchanges: [{"eid":"Futures_Binance","currency":"BTC_USDT"}]
*/

//@version=6
strategy("Gold 15m: Trend + S/R + Liquidity Sweep (RR 1:2)", overlay=true, default_qty_type=strategy.fixed, default_qty_value=1, commission_type=strategy.commission.percent, commission_value=0.0)

// ---------------------- INPUTS ----------------------
symbol_input = input.string(title="Symbol (for reference only)", defval="XAUUSD")
tf_note = input.timeframe(title="Intended timeframe", defval="15")
ema_len = input.int(200, "Trend EMA length", minval=50)
pivot_left = input.int(5, "Pivot left bars", minval=1)
pivot_right = input.int(5, "Pivot right bars", minval=1)
sweep_atr_mult = input.float(0.6, "Liquidity sweep buffer (ATR ×)", step=0.1)
sl_atr_mult = input.float(0.5, "SL buffer beyond pivot (ATR ×)", step=0.1)
min_sweep_bars = input.int(1, "Max bars between sweep and reclaim", minval=1)
use_only_trend = input.bool(true, "Only trade with trend (EMA filter)")
rr = input.float(2.0, "Reward/Risk (TP = RR × Risk)", minval=1.0, step=0.1)
enable_long = input.bool(true, "Enable Longs")
enable_short = input.bool(true, "Enable Shorts")
show_zones = input.bool(true, "Plot pivots / zones")

// ---------------------- INDICATORS ----------------------
ema_trend = ta.ema(close, ema_len)
atr = ta.atr(14)

// ---------------------- PIVOT S/R DETECTION ----------------------
// Using builtin pivots: returns price of pivot when formed, else na
ph = ta.pivothigh(high, pivot_left, pivot_right)
pl = ta.pivotlow(low, pivot_left, pivot_right)

// We'll track last confirmed pivot prices and bar index
var float lastPivotHigh = na
var int   lastPivotHighBar = na
var float lastPivotLow = na
var int   lastPivotLowBar = na

if not na(ph)
    lastPivotHigh := ph
    lastPivotHighBar := bar_index - pivot_right

if not na(pl)
    lastPivotLow := pl
    lastPivotLowBar := bar_index - pivot_right

// ---------------------- LIQUIDITY SWEEP DETECTION ----------------------
// For a bullish liquidity sweep (buy):
// 1) Price makes a new low wick below lastPivotLow - (atr * sweep_atr_mult) (sweep candle)
// 2) Within `min_sweep_bars` the price reclaims: close > lastPivotLow  => bullish signal
var int sweepLowBar = na
var int sweepHighBar = na

// detect sweep down (wick pierce)
isSweepDown = false
if not na(lastPivotLow)
    // a candle with low sufficiently below pivot
    isSweepDown := low < (lastPivotLow - atr * sweep_atr_mult)

// detect sweep up (wick pierce)
isSweepUp = false
if not na(lastPivotHigh)
    isSweepUp := high > (lastPivotHigh + atr * sweep_atr_mult)

// record bar of sweep
if isSweepDown
    sweepLowBar := bar_index
if isSweepUp
    sweepHighBar := bar_index

// check reclaim after sweep: close back above pivot (buy reclaim) or close back below pivot (sell reclaim)
// ensure reclaim happens within `min_sweep_bars` bars after sweep
bullReclaim = false
bearReclaim = false

if not na(lastPivotLow) and not na(sweepLowBar)
    if (bar_index - sweepLowBar) <= min_sweep_bars and close > lastPivotLow
        bullReclaim := true

if not na(lastPivotHigh) and not na(sweepHighBar)
    if (bar_index - sweepHighBar) <= min_sweep_bars and close < lastPivotHigh
        bearReclaim := true

// ---------------------- TREND FILTER ----------------------
in_uptrend = close > ema_trend
in_downtrend = close < ema_trend

// final entry conditions
longCondition  = enable_long  and bullReclaim and (not use_only_trend or in_uptrend)
shortCondition = enable_short and bearReclaim and (not use_only_trend or in_downtrend)

// Note: variable name required by Pine, we set from input
use_only_trend := use_only_trend  // no-op to fix linter if needed

// ---------------------- ORDER EXECUTION & SL/TP CALC ----------------------
var int tradeId = 0

// For buy: SL = lastPivotLow - (atr * sl_atr_mult)
// risk = entry - SL
// TP = entry + rr * risk
if longCondition
    // compute SL and TP
    sl_price = lastPivotLow - atr * sl_atr_mult
    entry_price = close
    risk_amt = entry_price - sl_price
    tp_price = entry_price + (risk_amt * rr)
    // safety: only place trade if positive distances
    if risk_amt > 0 and tp_price > entry_price
        tradeId += 1
        // send entry and exit with stop & limit
        strategy.entry("Long_"+str.tostring(tradeId), strategy.long)
        strategy.exit("ExitLong_"+str.tostring(tradeId), from_entry="Long_"+str.tostring(tradeId), stop=sl_price, limit=tp_price)

// For sell: SL = lastPivotHigh + (atr * sl_atr_mult)
// risk = SL - entry
// TP = entry - rr * risk
if shortCondition
    sl_price_s = lastPivotHigh + atr * sl_atr_mult
    entry_price_s = close
    risk_amt_s = sl_price_s - entry_price_s
    tp_price_s = entry_price_s - (risk_amt_s * rr)
    if risk_amt_s > 0 and tp_price_s < entry_price_s
        tradeId += 1
        strategy.entry("Short_"+str.tostring(tradeId), strategy.short)
        strategy.exit("ExitShort_"+str.tostring(tradeId), from_entry="Short_"+str.tostring(tradeId), stop=sl_price_s, limit=tp_price_s)

// ---------------------- PLOTTING ----------------------
// EMA (trend)
plot(ema_trend, title="EMA Trend", linewidth=2)

// arrows and markers for entries
plotshape(longCondition, title="Buy Signal", location=location.belowbar, style=shape.labelup, text="BUY", textcolor=color.white, size=size.tiny, color=color.green)
plotshape(shortCondition, title="Sell Signal", location=location.abovebar, style=shape.labeldown, text="SELL", textcolor=color.white, size=size.tiny, color=color.red)

// plot last SL/TP lines for last trade (visual reference)
// find last open position and plot currently active SL/TP if any
if strategy.position_size > 0
    last_sl = strategy.position_avg_price - (strategy.position_avg_price - (lastPivotLow - atr * sl_atr_mult))
    // instead use exit order price from last exit? Simpler: plot SL/TP computed earlier if long
    // This may plot approximate lines; TradingView native order lines will also display.
    // We skip redundant plotting to avoid confusion.