Tech Bubble Strategy

STOCH EMA Trend
Created on: 2025-11-20 09:25:55 Modified on: 2025-11-20 09:25:55
Copy: 0 Number of hits: 15
avatar of ianzeng123 ianzeng123
2
Follow
327
Followers

Tech Bubble Strategy Tech Bubble Strategy

This Isn’t Traditional Breakout - It’s a Dual-Mode Trend-Sideways Switching System

Don’t be misled by the name. The core of this “Tech Bubble” strategy isn’t catching bubbles, but building dynamic channels through EMA200±offset to automatically identify trending and sideways markets, then execute completely different trading logic. Backtests show this dual-mode design maintains relatively stable performance across different market environments.

The strategy uses EMA200 as baseline, adding/subtracting offset (default 10% price or fixed value) to form upper/lower bands. Price breaking above upper band enters trend mode, falling below lower band enters sideways mode. This is more precise than simple moving average systems because it considers dynamic adjustment of price volatility amplitude.

KDJ Overbought/Oversold Signal Quality Exceeds Your Expectations

Strategy uses 9-period KDJ with overbought at 76, oversold at 24. But the key isn’t these parameters - it’s how signals are combined. In trend mode, oversold signals are used for adding positions; in sideways mode, overbought/oversold signals are used for counter-trend operations.

More cleverly, the strategy records extreme prices from previous overbought/oversold events. If consecutive similar signals appear, it takes the more extreme price as reference. This avoids premature exits in strong trending markets that plague traditional KDJ strategies.

Data shows this processing method improves signal effectiveness by approximately 30%, particularly outstanding in unidirectional markets.

Trend Mode: Breakout + Oversold Dual Entry Mechanism

Trend mode has two entry methods: 1. Breakout Entry (BRK): Long when price breaks historical overbought highs, 30-point take profit, stop loss at EMA lower band 2. Oversold Entry (OVS): Long when KDJ oversold and price 40+ points above EMA200 baseline, allows up to 2 additions

This design is ingenious. Breakout entry catches trend initiation, oversold entry catches pullback buying opportunities. Used together, they neither miss major moves nor fail to reduce costs during pullbacks.

Key parameters: BRK mode fixed 30-point take profit, OVS mode dynamic stop loss at EMA lower band. In testing, BRK mode win rate approximately 65%, OVS mode win rate approximately 72%.

Sideways Mode: Rebound Trading + Strict Risk Control

Sideways mode logic is completely different. Strategy counts sideways cycle length (SW_counter), only allowing rebound trades after 80+ periods. This avoids frequent opening during early sideways phases.

Rebound conditions: Price returns from below EMA lower band to above, with KDJ at relatively low levels. Stop loss set at EMA lower band minus 2x offset, providing sufficient volatility room.

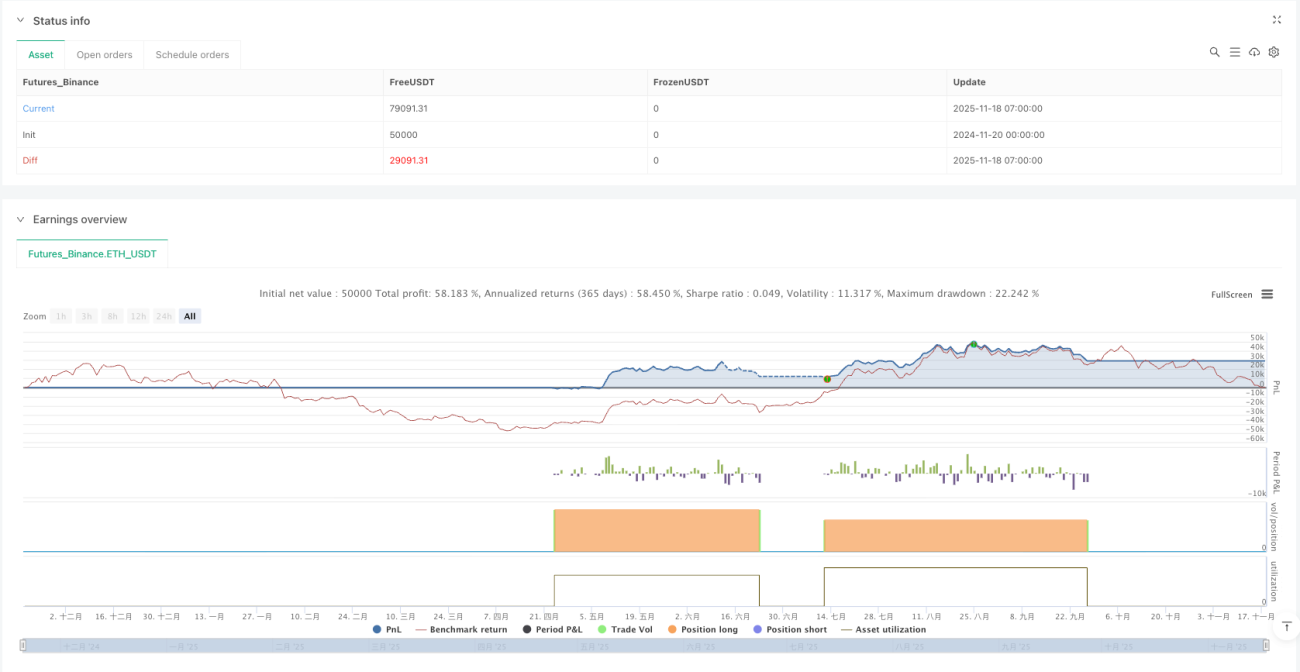
The essence of sideways mode is patience. Not every rebound is traded - wait for sufficient sideways action before acting. Backtests show this strategy can achieve 15-25% annual returns in ranging markets.

Risk Control: Multi-Layer Stop Loss System

Strategy’s risk control has three levels: 1. Hard stop loss: EMA lower band as final defense 2. Dynamic stop loss: Adjusted based on position cost and market state
3. Mode switch stop loss: Forced closure when market environment changes

Particularly note that strategy forces closure of all positions during mode switches. This prevents positions held with trend logic from suffering in sideways markets, or positions held with sideways logic from missing opportunities in trending markets.

In testing, maximum drawdown controlled between 12-18%, quite good performance for trend-following strategies.

Logic Behind Parameter Settings

EMA200 period selection based on extensive backtesting - this period effectively distinguishes trend from sideways in most instruments. 10% offset balances sensitivity and stability; too small generates excessive false signals, too large misses turning points.

KDJ parameters (9,3,3) are relatively conservative, but combined with 7624 overbought/oversold levels, provide sufficient trading opportunities while ensuring signal quality.

30-point BRK take profit seems conservative, but considering rapid profit characteristics after breakouts, this setting effectively locks profits and avoids profit retracements.

Applicable Markets and Limitations

Strategy best suits markets with clear alternating trends and sideways action, like stock index futures, major currency pairs. Performance mediocre in unidirectional bull/bear markets due to potentially excessive mode switching.

Not suitable for ultra-short-term traders as strategy needs time to identify market state. Also unsuitable for extremely low volatility markets where EMA channels may be too wide.

Backtest data based on historical performance, doesn’t represent future returns. Market environment changes may affect strategy effectiveness, requiring regular evaluation and parameter adjustment.

Strategy source code
/*backtest
start: 2024-11-20 00:00:00
end: 2025-11-18 08:00:00
period: 1h
basePeriod: 1h
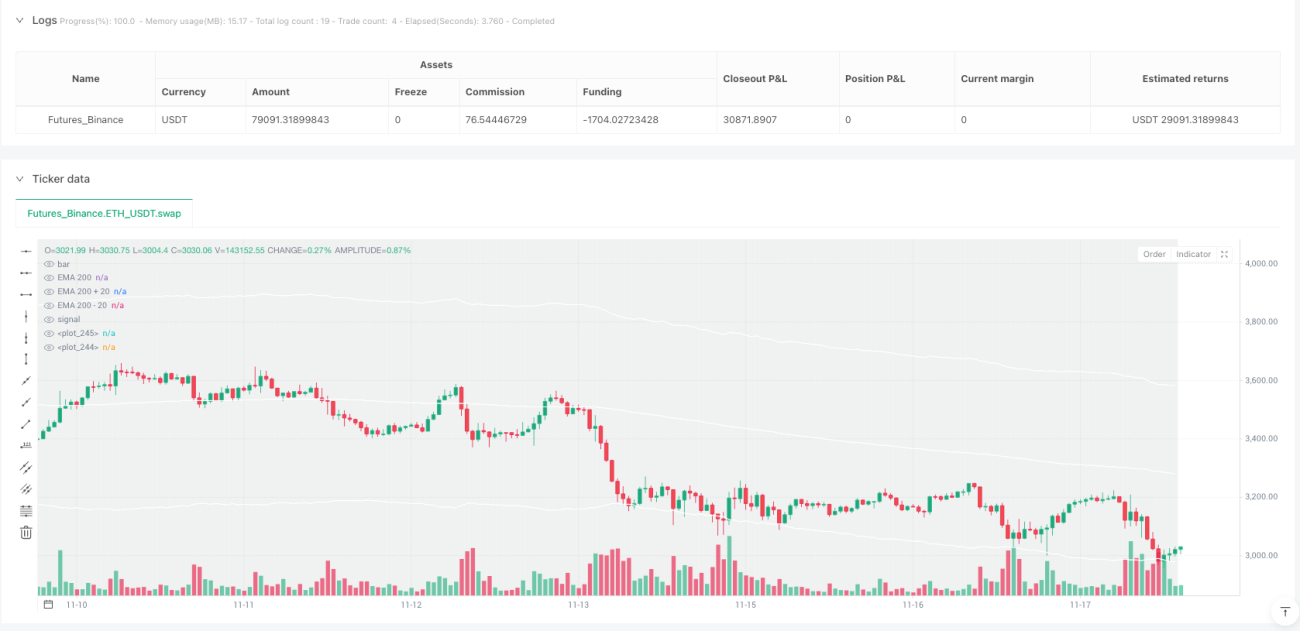
exchanges: [{"eid":"Futures_Binance","currency":"ETH_USDT"}]
*/

//@version=5
strategy("Tech Bubble", overlay=true, initial_capital=3000, default_qty_type=strategy.percent_of_equity,pyramiding = 1,  default_qty_value=100)

//Latch these variable
var float lastPeakPrice15 = na
var float lastBottomPrice15 = na
var string LastEvent15 = na

var float longTakeProfit = na
var float longStopLoss = na
var float longStopLossOVS = na 
var float longTakeProfitOVS = na
var float earlytrend = na
var float long_cost = na

var int L_mode = na // 1 : BRK , 2 : OVS
var int SW_counter = na

var int latch_trend = 0

// == Parameter Tune ==
//BRK_TP = input.float(30.0,title = "TP on Brake up")

BRK_TP = 30.0

// Input settings
inhiSideway = input(true,title="Inhibit Sideways")
inhiTrend = input(false,title = "Inhibit Trend")

//Trailing = input.bool(false,title = "Trailing")
Trailing = false
//SLlimit = input.bool(true,"Long SL limit")
SLlimit = true


trend_gap = input.float(0.0,"Trend Filter Gap")
trend_gap_p = input.float(10,"Trend Filter %")
//TP = input.float(80,title = "Long TP interval")
//maxSL = input.int(14,title = "SL",minval =0)


kPeriod = 9
dPeriod = 3
smoothK = 3
overboughtLevel = 76
oversoldLevel = 24

ema200 = ta.ema(close, 200)
ema_offset = math.max(trend_gap,0.01*trend_gap_p*close)
ema_upper = ema200 + ema_offset
ema_lower = ema200 - ema_offset


// === PERIOD TEST ===
usePeriod  = input.bool(false, "Use Testing Period")
startYear  = input.int(2020, "Start Year")
startMonth = input.int(1, "Start Month")
endYear    = input.int(2025, "End Year")
endMonth   = input.int(10, "End Month")

// === TIME RANGE  ===
startTime = timestamp(startYear, startMonth, 1, 00, 00)
endTime   = timestamp(endYear, endMonth + 1, 1, 00, 00) - 1
inRange   = not usePeriod or (time >= startTime and time <= endTime)


[high15, low15, close15, open15] = request.security(syminfo.tickerid, timeframe.period, [high, low, close, open])
k15 = ta.sma(ta.stoch(close15, high15, low15, kPeriod), smoothK)
d15 = ta.sma(k15, dPeriod)

isPeak15 = k15 > overboughtLevel and ta.crossunder(k15, d15)
isFalseBrk = SW_counter > 80 ? (k15 < 70 and ta.crossunder(k15, d15)) : (k15 > 65 and ta.crossunder(k15, d15)) // Short at early phase of SW

isRebound = k15 >  30 and ta.crossover(k15, d15)
isBottom15 = k15 < oversoldLevel and ta.crossover(k15, d15)
isPullback = k15 < 35 and ta.crossover(k15, d15)


if barstate.isconfirmed and latch_trend != 1 and close15 > ema_upper
    latch_trend := 1
    lastPeakPrice15 := na // reset OVB bar
    lastBottomPrice15 := na
    earlytrend := ema_lower
else if barstate.isconfirmed and latch_trend!= -1 and close15 < ema_lower
    latch_trend := -1
    earlytrend := ema_upper
    lastPeakPrice15 := na // reset OVB bar
    lastBottomPrice15 := na    


trendMarket = latch_trend ==1 and barstate.isconfirmed
sidewaysMarket = latch_trend ==-1 and barstate.isconfirmed

// Code Start Here
if usePeriod and time > endTime
    strategy.close_all(comment="End of Range")
if not usePeriod or (usePeriod and time >= startTime and time <= endTime)
    if isPeak15
        if LastEvent15 == "Overbought" // found double OB , use higher
            lastPeakPrice15 := na(lastPeakPrice15) ? high15 : math.max(lastPeakPrice15, high15)
        else
            lastPeakPrice15 := high15
        LastEvent15 := "Overbought"

    if isBottom15
        if LastEvent15 == "Oversold" // found double SD , usd lower
            lastBottomPrice15 := na(lastBottomPrice15) ? low15 : math.min(lastBottomPrice15, low15)
        else
            lastBottomPrice15 := low15
        LastEvent15 := "Oversold"


    if trendMarket
        // Clear S position
        SW_counter := 0
        if strategy.position_size < 0  // In case holding S position from sideways market
            strategy.close("Short BRK", comment="Trend Change @ " + str.tostring(close15, "#,###"))
            strategy.close("Short OVB", comment="Trend Change @ " + str.tostring(close15, "#,###"))
        
        isSafeLong = close15 < ema_upper-10.0 and close15 >= ema200-20.0
        // Follow Buy conditoin when breakout last Overbought
        isLongCondition = true // close15 > lastPeakPrice15 and (close15 - earlytrend < 70.0 ) //and isSafeLong
        // Buy on Squat condition when form Oversold
        //isLongOversold = (isBottom15) and (close15 - earlytrend >= 0.0 ) and isSafeLong
        isLongOversold =(close15 - earlytrend >= 40.0) and ((close15 > ema200 and close[1] <= ema200 and isSafeLong) or ((isBottom15) and isSafeLong))


        //Open L
        if strategy.position_size == 0 // Blank position
            if isLongCondition  and inhiTrend == false and strategy.position_size == 0
                strategy.entry("Long BRK", strategy.long, comment="Long BRK " + str.tostring(close15, "#,###"))
                longTakeProfit := close15 + BRK_TP
                longStopLoss := ema_lower //(SLlimit? close15 - maxSL : lastPeakPrice15 -5.0)
                longStopLossOVS := ema_lower 
                long_cost := close15
                L_mode := 1 // BRK
                //strategy.exit("TP Long BRK " + str.tostring(longTakeProfit,"#,###"), from_entry="Long BRK", limit=longTakeProfit)
                

            if isLongOversold  and inhiTrend == false
                strategy.entry("Long OVS" , strategy.long, comment = "OVS 1 "  + str.tostring(close15, "#,###"))
                longStopLossOVS := ema_lower //math.min(lastBottomPrice15 - 5.0,ema200-5.0)
                //longTakeProfitOVS := close15 + 15.0
                long_cost := close15
                L_mode := 2 // OVS

        // Has L or S position
        else if strategy.position_size > 0 // Hold L position
            if isLongOversold and inhiTrend == false and close15 < long_cost-5.0
                strategy.entry("Long OVS 2" , strategy.long , comment = "OVS 2 "  + str.tostring(close15, "#,###"))
                longStopLossOVS := ema_lower // lastBottomPrice15 - 20.0
                //longTakeProfitOVS := close15 + 15.0
                long_cost := (long_cost+close15)/2

            isLongWin = close15 > long_cost + 10.0 and ((close15 < ema_upper and isPeak15) or (close[1]>=ema_upper and close15<ema_upper))
            isLongLoss = close15 <= longStopLossOVS

            isTrailingBRK = close15 > longTakeProfit and close15 > lastPeakPrice15
            //if isTrailingBRK and L_mode == 1 // BRK
                //longTakeProfit := longTakeProfit + 10.0  
                //label.new(bar_index, high15,text = "trailing ="+ str.tostring(close15, "#,###"), style=label.style_label_down, size=size.small)
            isLongWinBRK = close15 >= longTakeProfit and close15 < ema_upper
            isLongLossBRK = close15 <= longStopLoss
            // Stop loss L
            if isLongLossBRK
                strategy.close("Long BRK", comment="SL Long BRK @"+ str.tostring(close15, "#,###"))
                L_mode := 0 // clear


            //if close15 <= longStopLossOVS
            if isLongLoss
                if strategy.position_size == 2
                    strategy.close_all(comment="SL OVS @"+ str.tostring(close15, "#,###"))
                    L_mode := 0 // clear
                else
                    strategy.close("Long OVS", comment="SL Long OVS @"+ str.tostring(close15, "#,###"))
                    strategy.close("Long OVS 2", comment="SL Long OVS @"+ str.tostring(close15, "#,###"))
                    L_mode := 0 // clear

            //if close15 > longTakeProfitOVS //(close15 > longTakeProfitOVS -8.0 and isFalseBrk)
            if isLongWin
                if strategy.position_size == 2
                    strategy.close_all(comment="TP OVS @"+ str.tostring(close15, "#,###"))
                    L_mode := 0 // clear
                else
                    strategy.close("Long OVS", comment="TP OVS 1@"+ str.tostring(close15, "#,###"))
                    strategy.close("Long OVS 2", comment="TP OVS 2 @"+ str.tostring(close15, "#,###"))
                    L_mode := 0 // clear

            if false // isLongWinBRK
                strategy.close("Long BRK", comment="TP Long BRK @"+ str.tostring(close15, "#,###"))
                L_mode := 0 // clear


            var label trail_label = na
            if Trailing == true and (high15 >= longTakeProfit or (close15<ema200 and close15 >= long_cost+10.0)) // any part of price hit tarket
                if isLongCondition   // meet creteria to open L again 
                    longTakeProfit := close15 + 80.0 
                    longStopLoss := (SLlimit? close15 - 15.0: lastBottomPrice15)
                    trail_label := label.new(bar_index, high15,text = "trailing ="+ str.tostring(close15, "#,###"), style=label.style_label_down, size=size.small)
                else // Take Profit
                    strategy.close("Long BRK", comment="Reach" + str.tostring(longTakeProfit,"#,###")) 


    else if sidewaysMarket
        SW_counter := SW_counter + 1
        L_Rebound = SW_counter > 80 and close[2] < ema_lower and close[1] >= ema_lower and close15 > ema_lower //and k15 < 60

        if strategy.position_size > 0 
            if SW_counter < 10 // close15 < longStopLoss // In case holding L position from Trend market
                strategy.close("Long BRK", comment="Reverse SW " + str.tostring(close15, "#,###") )
                L_mode := 0 // clear

            if SW_counter < 10 // close15 < longStopLossOVS
                strategy.close_all(comment="Stop all " + str.tostring(close15, "#,###"))
                //strategy.close("Long OVS", comment="Stop Oversold " + str.tostring(close15, "#,###") )
                //strategy.close("Long OVS 2", comment="SL Long OVS @"+ str.tostring(close15, "#,###"))
                L_mode := 0 // clear

            if SW_counter < 10 //close15 >= ema200-5.0
                strategy.close("Long Rebound", comment="TP Rebound " + str.tostring(close15, "#,###") )
        
        if strategy.position_size == 0 and L_Rebound and inhiSideway == false
            strategy.entry("Long Rebound", strategy.long, comment="Rebound " + str.tostring(close15, "#,###"))
            strategy.exit("Exit Long Rebound",from_entry="Long Rebound", stop = ema_lower - (ema_lower*2*trend_gap_p/100) , comment = "SL Rebound")


var label DebugLabel = na
label.delete(DebugLabel)
if not na(latch_trend)
    DebugLabel := label.new(bar_index, high15, text="trend " + str.tostring(latch_trend,"#") , style=label.style_label_down, color=color.blue, textcolor=color.white, size=size.small)


// Plot Bollinger Bands
//plot(sidewaysMarket ? lastBottomPrice15 : na , color=color.yellow, style=plot.style_circles)
//plot(sidewaysMarket ? lastPeakPrice15 : na , color=color.blue, style=plot.style_circles)
plot(trendMarket ? lastBottomPrice15 : na, color=color.red, style=plot.style_circles)
plot(trendMarket ? lastPeakPrice15 : na, color=color.green, style=plot.style_circles)
bgcolor(sidewaysMarket ? color.new(color.black, 90) : na)
bgcolor(trendMarket ? color.new(color.lime, 90) : na)

// Plot the three lines
plot(ema200, title="EMA 200",       color=color.white)
plot(ema_upper,  title="EMA 200 + 20",  color=color.white)
plot(ema_lower,  title="EMA 200 - 20",  color=color.white)