
BS, GAMMA, DELTA, THETA, VEGA
In the world of quantitative trading, there’s a seemingly paradoxical phenomenon: while retail investors become anxious due to market volatility, options market makers manage to profit consistently. What’s the secret behind this? The answer lies in the Black-Scholes-based gamma scalping strategy we’re analyzing today.
The core concept of this strategy is to simulate options market makers’ trading behavior: by constructing synthetic long straddle positions, utilizing gamma effects for dynamic hedging, and thus capturing profits through volatility arbitrage. Simply put, it’s about making mathematics work for us rather than fighting market emotions.
The Black-Scholes model isn’t just academic theory—it’s the cornerstone of modern options pricing. In this strategy, we focus on five Greek letters:
Delta (Δ): Measures option price sensitivity to underlying asset price changes. For straddle positions, Delta changes provide hedging signals.
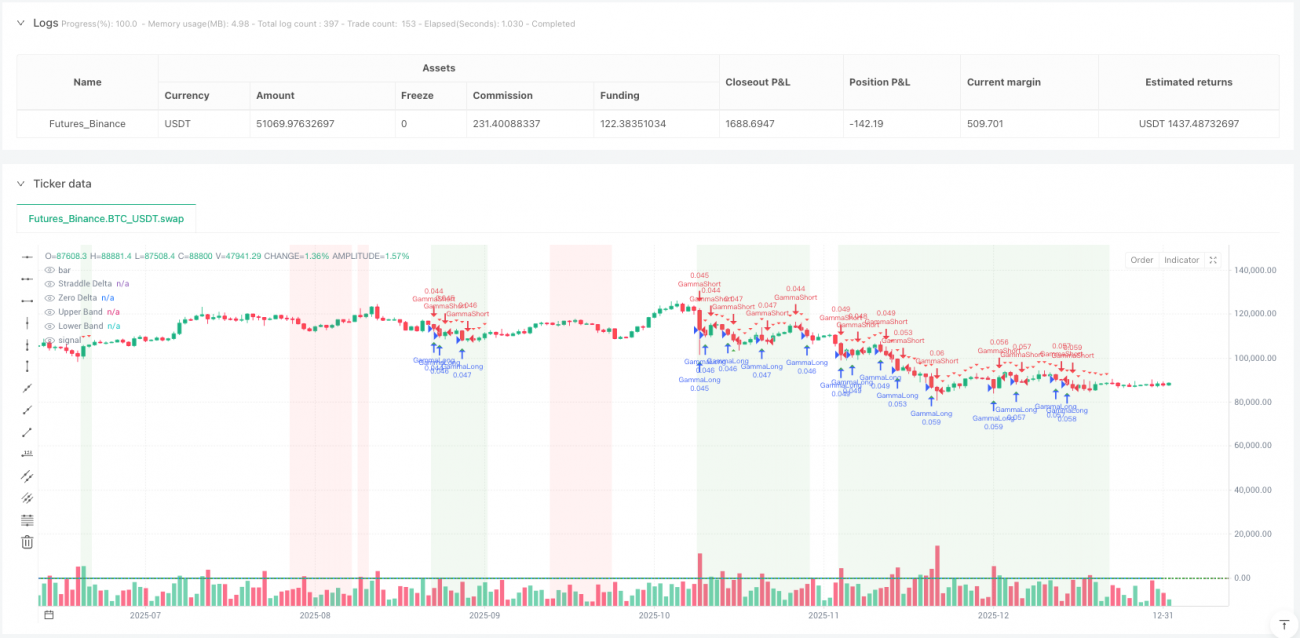
Gamma (Γ): The rate of Delta change, which is the strategy’s core. Positive gamma means Delta increases when prices rise and decreases when prices fall, creating “buy low, sell high” opportunities.
Theta (Θ): Time decay, representing the cost we need to overcome. Gamma trading profits can only cover time decay when realized volatility exceeds implied volatility.
Vega (ν): Sensitivity to volatility, helping us assess the volatility environment.
From the code implementation perspective, the strategy uses standard Black-Scholes formulas to calculate these Greeks, employing standard normal distribution functions (using Abramowitz & Stegun approximation) to ensure computational accuracy.
The strategy employs a three-layer signal filtering mechanism:
Layer 1: Volatility Regime Identification By comparing the ratio of historical volatility to implied volatility to determine the current volatility environment. When Historical Volatility/Implied Volatility > 1.2, it indicates actual market volatility exceeds options pricing expectations—an ideal environment for gamma scalping.
Layer 2: Gamma Scalping Trigger Trading signals are triggered when price movements exceed specific ATR multiples. This design is clever: it ensures we only execute hedging trades when there’s sufficient price movement, avoiding overtrading.
Layer 3: Delta Hedge Bands Hedging signals are generated when the net Delta of the straddle position deviates from neutral beyond set thresholds. This simulates market makers’ behavior of maintaining Delta neutrality.
Based on strategy logic analysis, optimal use cases include:
High Volatility Environments: When market realized volatility consistently exceeds implied volatility, gamma trading can generate excess returns.
Pullbacks in Trending Markets: Short-term retracements in strong trends often create excellent gamma scalping opportunities.
Event-Driven Volatility: Volatility changes around earnings, central bank decisions, and other events provide ideal trading environments for the strategy.
Note that the strategy has limited effectiveness in low-volatility consolidating markets, as price movements are insufficient to trigger effective gamma trading signals.
This strategy’s risk management reflects professional quantitative trading standards:
Dynamic Position Sizing: Adjusting position sizes based on volatility—reducing positions during high volatility and increasing them during low volatility, contrasting sharply with traditional fixed position management.
Multi-Layer Stop Mechanisms: Combining ATR-multiple stops, maximum drawdown protection, and time-value-based exit mechanisms.
Concurrent Position Limits: Controlling overall risk exposure by limiting maximum simultaneous positions.
Innovative Aspects: 1. Complete migration of complex options Greeks calculations to stock/futures trading 2. Dynamic volatility regime identification rather than static parameters 3. Multi-dimensional signal confirmation mechanisms reducing false signals
Potential Limitations: 1. Sensitivity to trading costs, requiring low commission environments 2. Black-Scholes model assumptions may fail under extreme market conditions 3. High strategy complexity requiring thorough backtesting validation
Based on in-depth code analysis, I recommend:
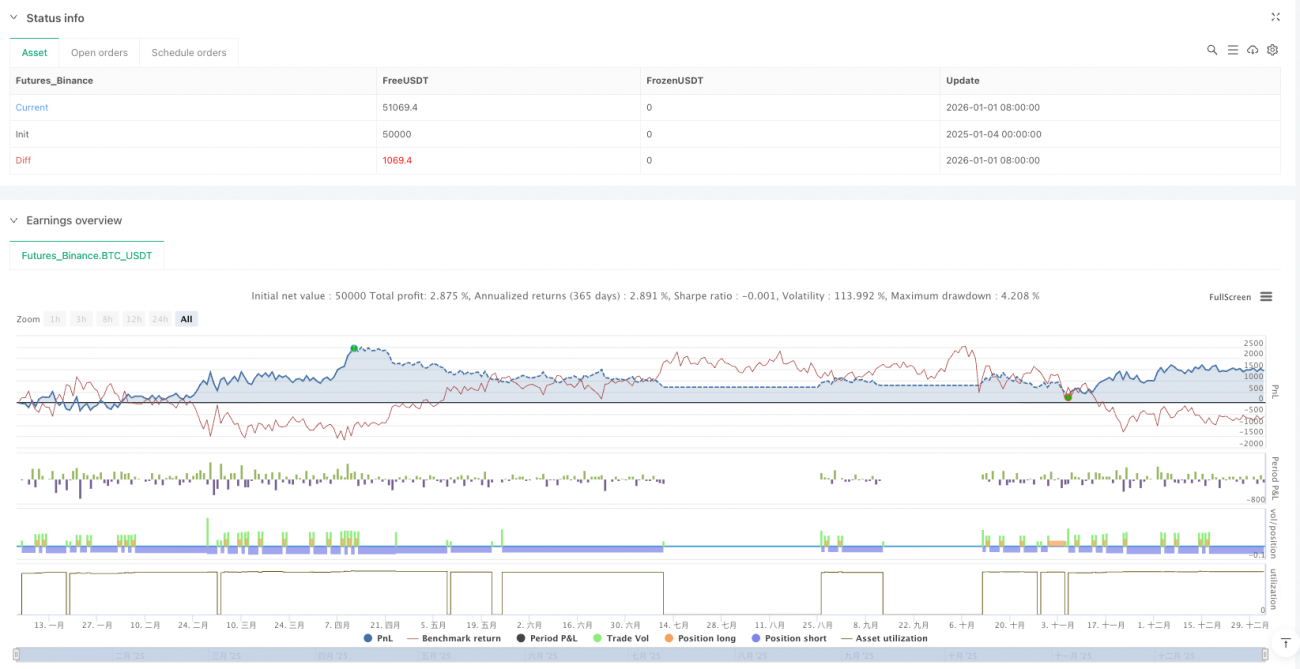
This strategy showcases the charm of quantitative trading: using mathematical models to simplify complex market behaviors into executable trading rules. While it cannot guarantee every trade will be profitable, from a long-term perspective, it provides us with a positive expected value trading framework.
For quantitative traders seeking to understand the essence of options trading, this strategy is undoubtedly an excellent learning case. It not only demonstrates how to transform theory into practice but, more importantly, reveals how professional traders think about markets: not predicting direction, but managing risk and letting probability work for us.
/*backtest
start: 2025-01-04 00:00:00
end: 2026-01-02 00:00:00
period: 1d
basePeriod: 1d
exchanges: [{"eid":"Futures_Binance","currency":"BTC_USDT"}]
*/
//@version=6
strategy("Black-Scholes Gamma Scalping Strategy",
overlay=true,
default_qty_type=strategy.percent_of_equity,
default_qty_value=10,
pyramiding=5)
// ============================================================================
// STRATEGY CONCEPT:
// This strategy simulates gamma scalping - a volatility arbitrage technique
// used by options market makers. The core idea:
//
// 1. We model a synthetic long straddle position (long call + long put)
// 2. The straddle has positive gamma, meaning delta changes as price moves
// 3. We continuously delta-hedge by trading the underlying
// 4. If realized volatility > implied volatility, hedging profits exceed theta decay
// 5. Trading signals generated when price moves create hedging opportunities
//
// The Black-Scholes equation provides: Delta, Gamma, Theta, Vega
// ============================================================================
// === INPUT PARAMETERS ===
string grp_opt = "Option Parameters"
strike_offset_pct = input.float(0.0, "Strike Offset from Current Price %", group=grp_opt, step=0.5)
days_to_expiry = input.int(30, "Days to Expiration", group=grp_opt, minval=1, maxval=365)
implied_vol = input.float(0.25, "Implied Volatility (Annual)", group=grp_opt, minval=0.05, maxval=2.0, step=0.01)
risk_free_rate = input.float(0.05, "Risk-Free Rate (Annual)", group=grp_opt, step=0.001)
dividend_yield = input.float(0.0, "Dividend Yield (Annual)", group=grp_opt, step=0.001)
string grp_vol = "Volatility Analysis"
hist_vol_period = input.int(20, "Historical Volatility Period", group=grp_vol, minval=5)
vol_ratio_threshold = input.float(1.2, "HV/IV Ratio for Long Vol Signal", group=grp_vol, minval=1.0, step=0.05)
vol_ratio_short = input.float(0.8, "HV/IV Ratio for Short Vol Signal", group=grp_vol, minval=0.1, maxval=1.0, step=0.05)
string grp_trade = "Trading Parameters"
gamma_scalp_threshold = input.float(0.5, "Gamma Scalp Threshold (ATR mult)", group=grp_trade, minval=0.1, step=0.1)
hedge_band_pct = input.float(2.0, "Delta Hedge Band %", group=grp_trade, minval=0.5, step=0.5)
use_vol_filter = input.bool(true, "Use Volatility Regime Filter", group=grp_trade)
max_positions = input.int(3, "Max Concurrent Positions", group=grp_trade, minval=1, maxval=10)
string grp_risk = "Risk Management"
stop_loss_atr_mult = input.float(2.0, "Stop Loss (ATR Multiple)", group=grp_risk, minval=0.5, step=0.5)
take_profit_atr_mult = input.float(3.0, "Take Profit (ATR Multiple)", group=grp_risk, minval=1.0, step=0.5)
max_drawdown_pct = input.float(15.0, "Max Drawdown % to Pause Trading", group=grp_risk, minval=5.0, step=1.0)
// ============================================================================
// BLACK-SCHOLES MATHEMATICAL FUNCTIONS
// ============================================================================
// --- Standard Normal CDF (Abramowitz & Stegun approximation) ---
norm_cdf(float x) =>
float result = 0.0
if na(x)
result := na
else
float ax = math.abs(x)
if ax > 10
result := x > 0 ? 1.0 : 0.0
else
float t = 1.0 / (1.0 + 0.2316419 * ax)
float d = 0.3989422804 * math.exp(-0.5 * x * x) // 1/sqrt(2*pi) * exp(-x²/2)
float p = t * (0.31938153 + t * (-0.356563782 + t * (1.781477937 + t * (-1.821255978 + t * 1.330274429))))
result := x >= 0 ? 1.0 - d * p : d * p
result
// --- Standard Normal PDF ---
norm_pdf(float x) =>
na(x) ? na : 0.3989422804 * math.exp(-0.5 * x * x)
// --- Black-Scholes d1 and d2 ---
bs_d1(float S, float K, float r, float q, float sigma, float T) =>
T > 0 and sigma > 0 ? (math.log(S / K) + (r - q + 0.5 * sigma * sigma) * T) / (sigma * math.sqrt(T)) : na
bs_d2(float S, float K, float r, float q, float sigma, float T) =>
float d1 = bs_d1(S, K, r, q, sigma, T)
na(d1) ? na : d1 - sigma * math.sqrt(T)
// --- Greeks ---
// Call Delta
call_delta(float S, float K, float r, float q, float sigma, float T) =>
T <= 0 ? (S >= K ? 1.0 : 0.0) : math.exp(-q * T) * norm_cdf(bs_d1(S, K, r, q, sigma, T))
// Put Delta
put_delta(float S, float K, float r, float q, float sigma, float T) =>
T <= 0 ? (S <= K ? -1.0 : 0.0) : math.exp(-q * T) * (norm_cdf(bs_d1(S, K, r, q, sigma, T)) - 1)
// Gamma (same for call and put)
option_gamma(float S, float K, float r, float q, float sigma, float T) =>
if T <= 0 or sigma <= 0
0.0
else
float d1 = bs_d1(S, K, r, q, sigma, T)
math.exp(-q * T) * norm_pdf(d1) / (S * sigma * math.sqrt(T))
// ============================================================================
// HISTORICAL VOLATILITY CALCULATION
// ============================================================================
// Calculate annualized historical volatility
calc_historical_vol(int period) =>
float log_return = math.log(close / close[1])
float std_dev = ta.stdev(log_return, period)
// Annualization factor based on timeframe
float periods_per_year = switch
timeframe.isdaily => 365.0
timeframe.isweekly => 52.0
timeframe.ismonthly => 12.0
=> 365.0 * 390.0 / (timeframe.isminutes ? timeframe.multiplier : 1440.0)
nz(std_dev * math.sqrt(periods_per_year), 0.20)
hist_vol = calc_historical_vol(hist_vol_period)
// ============================================================================
// STRATEGY CALCULATIONS
// ============================================================================
// Dynamic strike price (ATM or offset)
float atm_strike = math.round(close / syminfo.mintick) * syminfo.mintick
float strike_price = atm_strike * (1 + strike_offset_pct / 100)
// Time to expiration in years
float tau = days_to_expiry / 365.0
// Calculate Greeks for synthetic straddle (1 call + 1 put at same strike)
float c_delta = call_delta(close, strike_price, risk_free_rate, dividend_yield, implied_vol, tau)
float p_delta = put_delta(close, strike_price, risk_free_rate, dividend_yield, implied_vol, tau)
float straddle_delta = c_delta + p_delta // Net delta of straddle
float gamma = option_gamma(close, strike_price, risk_free_rate, dividend_yield, implied_vol, tau)
float straddle_gamma = 2 * gamma // Straddle has 2x gamma
// Volatility ratio: Historical / Implied
float vol_ratio = hist_vol / implied_vol
// ATR for position sizing and stops
float atr = ta.atr(14)
// ============================================================================
// TRADING SIGNALS
// ============================================================================
// --- Signal 1: Volatility Regime ---
// Long volatility when realized > implied (gamma scalping profitable)
// Short volatility when realized < implied (collect theta)
bool long_vol_regime = vol_ratio > vol_ratio_threshold
bool short_vol_regime = vol_ratio < vol_ratio_short
// --- Signal 2: Gamma Scalp Trigger ---
// When price moves significantly, delta changes. We trade to capture this.
float price_move = close - close[1]
float move_threshold = atr * gamma_scalp_threshold
bool significant_up_move = price_move > move_threshold
bool significant_down_move = price_move < -move_threshold
// --- Signal 3: Delta Hedge Bands ---
// Trade when straddle delta deviates from neutral
float delta_band = hedge_band_pct / 100
bool delta_long_signal = straddle_delta < -delta_band // Need to buy to hedge
bool delta_short_signal = straddle_delta > delta_band // Need to sell to hedge
// --- Combined Entry Signals ---
bool vol_filter = use_vol_filter ? long_vol_regime : true
// Long entry: Price dropped significantly OR delta needs positive hedge
bool long_entry = vol_filter and (significant_down_move or delta_long_signal)
// Short entry: Price rose significantly OR delta needs negative hedge
bool short_entry = vol_filter and (significant_up_move or delta_short_signal)
// ============================================================================
// RISK MANAGEMENT
// ============================================================================
// Track equity for drawdown protection
var float equity_peak = strategy.initial_capital
equity_peak := math.max(equity_peak, strategy.equity)
float current_drawdown = (equity_peak - strategy.equity) / equity_peak * 100
bool drawdown_exceeded = current_drawdown > max_drawdown_pct
// Position counting
int open_trades = strategy.opentrades
// ============================================================================
// STRATEGY EXECUTION
// ============================================================================
// Stop loss and take profit levels
float long_stop = close - atr * stop_loss_atr_mult
float long_target = close + atr * take_profit_atr_mult
float short_stop = close + atr * stop_loss_atr_mult
float short_target = close - atr * take_profit_atr_mult
// Entry conditions
bool can_trade = not drawdown_exceeded and open_trades < max_positions
if can_trade
// Long entries
if long_entry and strategy.position_size <= 0
strategy.entry("GammaLong", strategy.long,
comment="Δ:" + str.tostring(straddle_delta, "#.##") + " Γ:" + str.tostring(straddle_gamma, "#.###"))
strategy.exit("LongExit", "GammaLong", stop=long_stop, limit=long_target)
// Short entries
if short_entry and strategy.position_size >= 0
strategy.entry("GammaShort", strategy.short,
comment="Δ:" + str.tostring(straddle_delta, "#.##") + " Γ:" + str.tostring(straddle_gamma, "#.###"))
strategy.exit("ShortExit", "GammaShort", stop=short_stop, limit=short_target)
// Exit on extreme conditions
if drawdown_exceeded
strategy.close_all(comment="Drawdown Protection")
// Exit if volatility regime shifts against us
if use_vol_filter and short_vol_regime and strategy.position_size != 0
strategy.close_all(comment="Vol Regime Shift")
// ============================================================================
// VISUALIZATIONS
// ============================================================================
// Plot straddle delta
plot(straddle_delta, "Straddle Delta", color=color.blue, linewidth=2)
hline(0, "Zero Delta", color=color.gray, linestyle=hline.style_dashed)
hline(delta_band, "Upper Band", color=color.red, linestyle=hline.style_dotted)
hline(-delta_band, "Lower Band", color=color.green, linestyle=hline.style_dotted)
// Background color for volatility regime
bgcolor(long_vol_regime ? color.new(color.green, 90) : short_vol_regime ? color.new(color.red, 90) : na)
// Entry signals
plotshape(long_entry and can_trade, "Long Signal", shape.triangleup, location.belowbar, color.green, size=size.small)
plotshape(short_entry and can_trade, "Short Signal", shape.triangledown, location.abovebar, color.red, size=size.small)
// ============================================================================
// ALERTS
// ============================================================================
alertcondition(long_entry and can_trade, "Gamma Long Entry", "BS Strategy: Long entry signal - Delta={{straddle_delta}}")
alertcondition(short_entry and can_trade, "Gamma Short Entry", "BS Strategy: Short entry signal - Delta={{straddle_delta}}")
alertcondition(drawdown_exceeded, "Drawdown Alert", "BS Strategy: Max drawdown exceeded - trading paused")