Statistical Arbitrage Strategy


Created on: 2026-03-12 11:50:47 Modified on: 2026-03-12 11:50:47
Copy: 0 Number of hits: 22
avatar of ianzeng123 ianzeng123
2
Follow
413
Followers

Statistical Arbitrage Strategy Statistical Arbitrage Strategy

ZSCORE, RSI, ATR, SMA, EMA

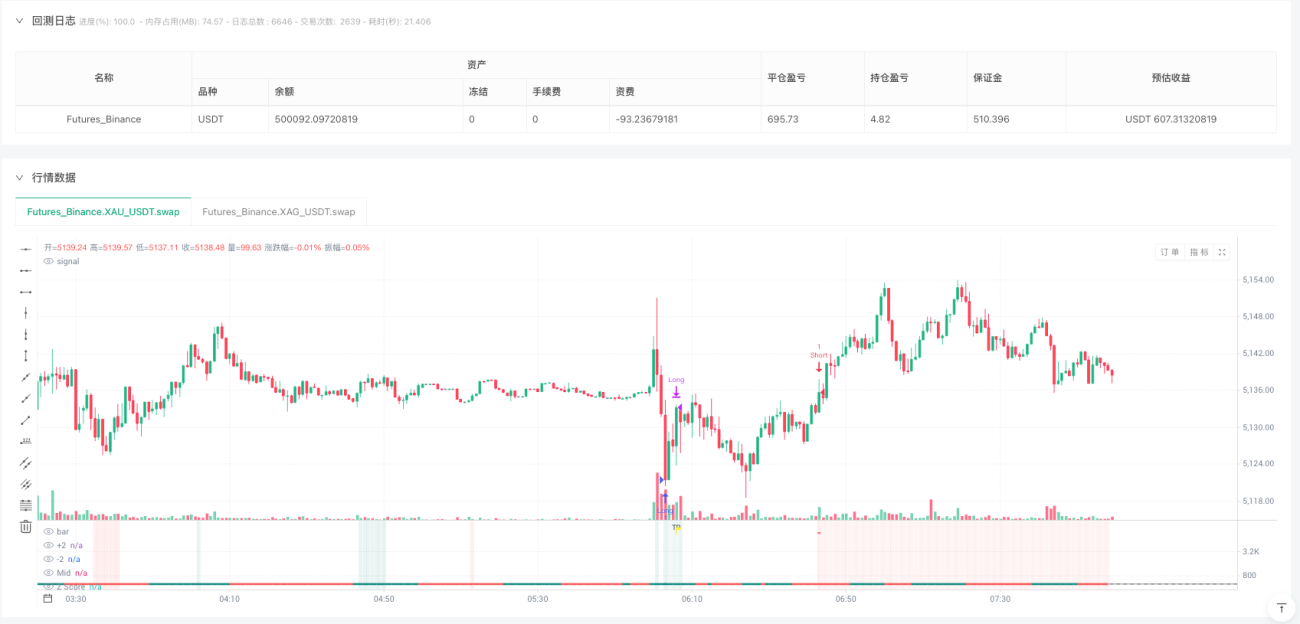
Z-Score Statistical Arbitrage: Mathematical Game of Gold-Silver Ratio
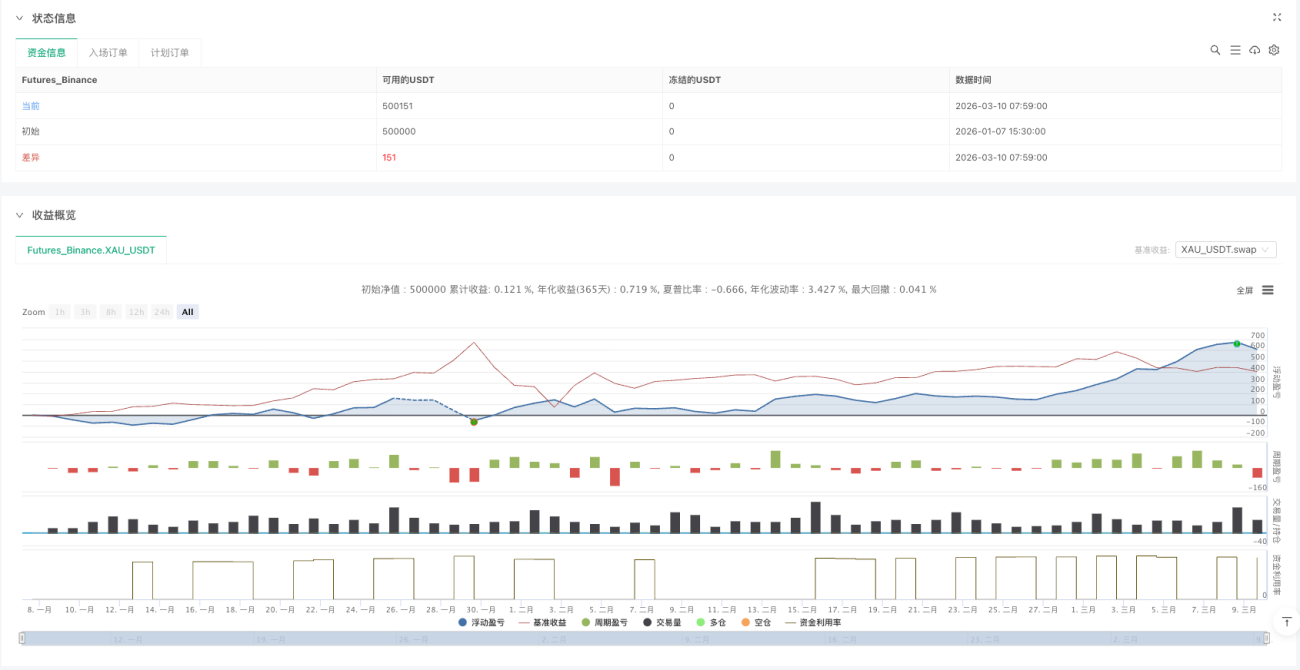
This isn’t your typical trend-following strategy. The XAG/XAU statistical arbitrage strategy operates on a core assumption: gold and silver prices maintain a long-term mean-reverting relationship. When Z-Score breaks beyond ±2 standard deviations, price deviation reaches statistical significance, providing entry opportunities for reversion trades. Backtesting data shows this statistical arbitrage approach delivers superior risk-adjusted returns in precious metals markets.

20-Period Normalized Ratio: More Precise Than Traditional Correlation Analysis

The strategy’s core builds a normalized price ratio model. Using 20-period SMA to standardize XAG and XAU separately, then calculating the ratio smoothed with 3-period EMA. This approach proves more stable than simple price ratios, effectively filtering short-term noise. When the normalized ratio’s Z-Score exceeds ±2 boundaries, it indicates current prices deviate from historical mean by over 2 standard deviations—statistically a low-probability event, providing mean reversion entry timing.

RSI Filter: Clever Use of the 50 Midline

Unlike traditional RSI overbought/oversold signals, this uses RSI=50 as long/short filter condition. RSI<50 allows long positions, RSI>50 allows short positions. The logic is clear: buy during relative weakness expecting bounce, sell during relative strength expecting pullback. This filtering mechanism effectively reduces counter-trend trading risks and improves signal quality.

3:8 ATR Risk-Reward Ratio: Positive Mathematical Expectation

Take profit set at 3x ATR, stop loss at 8x ATR, achieving 1:2.67 risk-reward ratio. This design leverages statistical arbitrage characteristics: mean reversion probability is relatively high, but requires sufficient tolerance space. 14-period ATR ensures stop/target levels adapt to market volatility changes. Historical backtests show this ratio achieves positive expected returns in precious metals pair trading.

Applicable Scenarios: Ranging Markets Outperform Trending Markets

Statistical arbitrage strategies perform best in sideways choppy conditions, where mean reversion characteristics are more pronounced. In strong trending markets, prices may deviate from mean for extended periods, causing significant drawdown risks. Recommended use during moderate volatility periods without obvious directional bias. Note that precious metals markets are heavily influenced by macroeconomic factors—exercise caution during major event periods.

Risk Warning: Statistical Model Limitations

Historical statistical relationships don’t guarantee future continuation. Gold-silver ratios may experience long-term shifts due to supply-demand structural changes, monetary policy differences, and other factors. Strategy faces consecutive loss risks, particularly during market structural change periods. Recommend strict risk management, limiting single trade risk to no more than 2% of account capital, and regularly evaluating strategy effectiveness.

Strategy source code
//@version=6
strategy("Stat Arb(xag & xau)")

// ══════════════════════════════════════════════════════════════
// BENCHMARK DATA
// ══════════════════════════════════════════════════════════════
float benchClose = request.security("XAG_USDT.swap", timeframe.period, close)

// ══════════════════════════════════════════════════════════════
// HELPER FUNCTIONS
// ══════════════════════════════════════════════════════════════
f_cov(float src1, float src2, int len) =>
    ta.sma(src1 * src2, len) - ta.sma(src1, len) * ta.sma(src2, len)

f_var(float src, int len) =>
    ta.sma(src * src, len) - math.pow(ta.sma(src, len), 2)

// ══════════════════════════════════════════════════════════════
// SPREAD ENGINE — NORMALIZED RATIO
// ══════════════════════════════════════════════════════════════
int lookback = 20

float pairSma   = ta.sma(close,      lookback)
float benchSma  = ta.sma(benchClose, lookback)
float pairNorm  = pairSma  != 0 ? close      / pairSma  * 100.0 : 100.0
float benchNorm = benchSma != 0 ? benchClose / benchSma * 100.0 : 100.0
float modelRaw  = benchNorm != 0 ? pairNorm / benchNorm : 1.0
float model     = ta.ema(modelRaw, 3)

float zMean  = ta.sma(model, lookback)
float zStd   = ta.stdev(model, lookback)
float zScore = zStd != 0 ? (model - zMean) / zStd : 0.0

// ══════════════════════════════════════════════════════════════
// RSI FILTER — BELOW / ABOVE 50
// ══════════════════════════════════════════════════════════════
float rsiVal    = ta.rsi(close, 14)
bool  rsiLongOk  = rsiVal < 50.0
bool  rsiShortOk = rsiVal > 50.0

// ══════════════════════════════════════════════════════════════
// ENTRY SIGNALS
// Z crosses below -2 = long, above +2 = short
// ══════════════════════════════════════════════════════════════
bool enterLong  = ta.crossunder(zScore, -2.0) and rsiLongOk
bool enterShort = ta.crossover(zScore,   2.0) and rsiShortOk

// ══════════════════════════════════════════════════════════════
// ATR STOP + TAKE PROFIT
// Stop:  8x ATR from entry (hardcoded)
// TP:    3x ATR from entry (hardcoded), stamped at entry
// ══════════════════════════════════════════════════════════════
float atrVal = ta.atr(14)

var float tpLevel   = na
var float slLevel   = na
var float entryPrice = na

bool isNewEntry = strategy.position_size != 0 and strategy.position_size[1] == 0
if isNewEntry
    entryPrice := strategy.position_avg_price
    if strategy.position_size > 0
        tpLevel := entryPrice + atrVal * 3.0
        slLevel := entryPrice - atrVal * 8.0
    else
        tpLevel := entryPrice - atrVal * 3.0
        slLevel := entryPrice + atrVal * 8.0

if strategy.position_size == 0
    tpLevel    := na
    slLevel    := na
    entryPrice := na

// ══════════════════════════════════════════════════════════════
// EXIT CONDITIONS — high/low for intrabar touch
// ══════════════════════════════════════════════════════════════
bool tpHitLong  = strategy.position_size > 0 and not na(tpLevel) and high >= tpLevel
bool tpHitShort = strategy.position_size < 0 and not na(tpLevel) and low  <= tpLevel
bool slHitLong  = strategy.position_size > 0 and not na(slLevel) and low  <  slLevel
bool slHitShort = strategy.position_size < 0 and not na(slLevel) and high >  slLevel

// ══════════════════════════════════════════════════════════════
// EXECUTION
// ══════════════════════════════════════════════════════════════
if enterLong
    strategy.close("Short", comment="Flip")
    strategy.entry("Long",  strategy.long)
if enterShort
    strategy.close("Long",  comment="Flip")
    strategy.entry("Short", strategy.short)

if tpHitLong
    strategy.close("Long",  comment="TP")
if tpHitShort
    strategy.close("Short", comment="TP")
if slHitLong
    strategy.close("Long",  comment="SL")
if slHitShort
    strategy.close("Short", comment="SL")

// ══════════════════════════════════════════════════════════════
// VISUALS
// ══════════════════════════════════════════════════════════════
hline( 2.0, "+2",  color=color.new(color.red,  20), linestyle=hline.style_dashed)
hline(-2.0, "-2",  color=color.new(color.teal, 20), linestyle=hline.style_dashed)
hline( 0.0, "Mid", color=color.gray,                linestyle=hline.style_solid)

color zCol = zScore >= 0 ? color.new(color.red, 10) : color.new(color.teal, 10)
plot(zScore, title="Z Score", color=zCol, linewidth=3)

bgcolor(zScore >  2.0 ? color.new(color.red,  90) : na, title="Overbought Zone")
bgcolor(zScore < -2.0 ? color.new(color.teal, 90) : na, title="Oversold Zone")
bgcolor(strategy.position_size > 0 ? color.new(color.teal, 93) : na, title="In Long")
bgcolor(strategy.position_size < 0 ? color.new(color.red,  93) : na, title="In Short")

plotshape(enterLong,  style=shape.triangleup,   location=location.bottom, color=color.teal, size=size.small)
plotshape(enterShort, style=shape.triangledown, location=location.top,    color=color.red,  size=size.small)
plotshape(tpHitLong or tpHitShort, style=shape.flag,   location=location.top, color=color.yellow, size=size.tiny, text="TP")
plotshape(slHitLong or slHitShort, style=shape.xcross, location=location.top, color=color.orange, size=size.tiny, text="SL")