
"Estrategia mágica de media móvil EMA doble" de YouTube Master
En este número, analizaremos una "estrategia mágica de media móvil doble EMA" de YouTube, denominada "el asesino del mercado de acciones y criptomonedas". Después de ver el video, aprendí que esta estrategia es una estrategia de lenguaje de vista comercial, que utiliza 2 indicadores de vista comercial. Al ver que los resultados del backtesting en el video fueron muy buenos, y FMZ también soporta el lenguaje Pine de Trading View, no pude evitar querer hacer backtesting y probar el análisis yo mismo. ¡Entonces empieza toda la vida! Repitamos la estrategia en el vídeo.
Indicadores utilizados por la estrategia
- Indicador EMA
Para simplificar el diseño, no utilizaremos la media móvil exponencial que aparece en el vídeo. En su lugar, utilizamos el ta.ema incorporado en la vista comercial (en realidad, son lo mismo).
- Indicador VuManChu Swing Free
Este es un indicador de Trading View. Tenemos que ir a Trading View y descargar el código fuente.
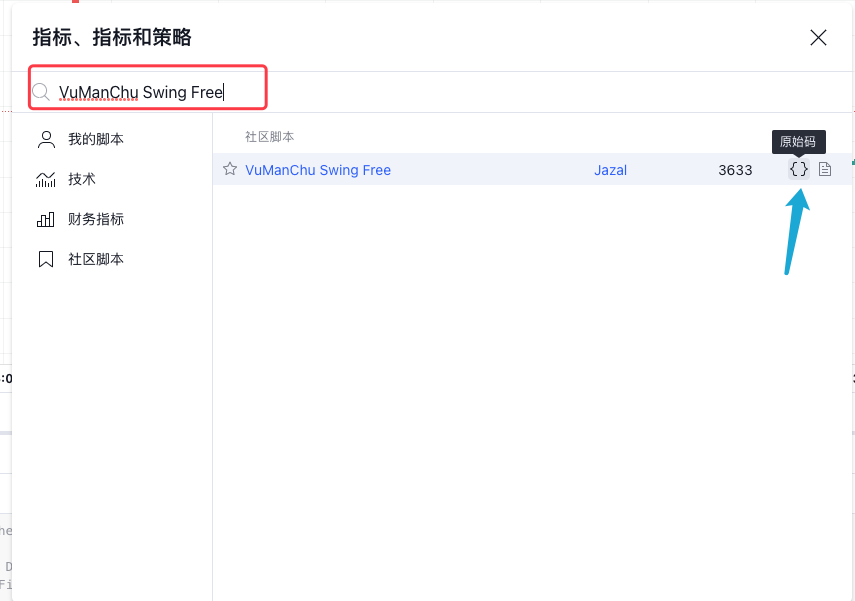
Código gratuito de VuManChu Swing:
pine
// This source code is subject to the terms of the Mozilla Public License 2.0 at https://mozilla.org/MPL/2.0/
// Credits to the original Script - Range Filter DonovanWall https://www.tradingview.com/script/lut7sBgG-Range-Filter-DW/
// This version is the old version of the Range Filter with less settings to tinker with
//@version=4
study(title="Range Filter - B&S Signals", shorttitle="RF - B&S Signals", overlay=true)
//-----------------------------------------------------------------------------------------------------------------------------------------------------------------
//Functions
//-----------------------------------------------------------------------------------------------------------------------------------------------------------------
//Range Size Function
rng_size(x, qty, n)=>
// AC = Cond_EMA(abs(x - x[1]), 1, n)
wper = (n*2) - 1
avrng = ema(abs(x - x[1]), n)
AC = ema(avrng, wper)*qty
rng_size = AC
//Range Filter Function
rng_filt(x, rng_, n)=>
r = rng_
var rfilt = array.new_float(2, x)
array.set(rfilt, 1, array.get(rfilt, 0))
if x - r > array.get(rfilt, 1)
array.set(rfilt, 0, x - r)
if x + r < array.get(rfilt, 1)
array.set(rfilt, 0, x + r)
rng_filt1 = array.get(rfilt, 0)
hi_band = rng_filt1 + r
lo_band = rng_filt1 - r
rng_filt = rng_filt1
[hi_band, lo_band, rng_filt]
//-----------------------------------------------------------------------------------------------------------------------------------------------------------------
//Inputs
//-----------------------------------------------------------------------------------------------------------------------------------------------------------------
//Range Source
rng_src = input(defval=close, type=input.source, title="Swing Source")
//Range Period
rng_per = input(defval=20, minval=1, title="Swing Period")
//Range Size Inputs
rng_qty = input(defval=3.5, minval=0.0000001, title="Swing Multiplier")
//Bar Colors
use_barcolor = input(defval=false, type=input.bool, title="Bar Colors On/Off")
//-----------------------------------------------------------------------------------------------------------------------------------------------------------------
//Definitions
//-----------------------------------------------------------------------------------------------------------------------------------------------------------------
//Range Filter Values
[h_band, l_band, filt] = rng_filt(rng_src, rng_size(rng_src, rng_qty, rng_per), rng_per)
//Direction Conditions
var fdir = 0.0
fdir := filt > filt[1] ? 1 : filt < filt[1] ? -1 : fdir
upward = fdir==1 ? 1 : 0
downward = fdir==-1 ? 1 : 0
//Trading Condition
longCond = rng_src > filt and rng_src > rng_src[1] and upward > 0 or rng_src > filt and rng_src < rng_src[1] and upward > 0
shortCond = rng_src < filt and rng_src < rng_src[1] and downward > 0 or rng_src < filt and rng_src > rng_src[1] and downward > 0
CondIni = 0
CondIni := longCond ? 1 : shortCond ? -1 : CondIni[1]
longCondition = longCond and CondIni[1] == -1
shortCondition = shortCond and CondIni[1] == 1
//Colors
filt_color = upward ? #05ff9b : downward ? #ff0583 : #cccccc
bar_color = upward and (rng_src > filt) ? (rng_src > rng_src[1] ? #05ff9b : #00b36b) :
downward and (rng_src < filt) ? (rng_src < rng_src[1] ? #ff0583 : #b8005d) : #cccccc
//-----------------------------------------------------------------------------------------------------------------------------------------------------------------
//Outputs
//-----------------------------------------------------------------------------------------------------------------------------------------------------------------
//Filter Plot
filt_plot = plot(filt, color=filt_color, transp=67, linewidth=3, title="Filter")
//Band Plots
h_band_plot = plot(h_band, color=color.new(#05ff9b, 100), title="High Band")
l_band_plot = plot(l_band, color=color.new(#ff0583, 100), title="Low Band")
//Band Fills
fill(h_band_plot, filt_plot, color=color.new(#00b36b, 92), title="High Band Fill")
fill(l_band_plot, filt_plot, color=color.new(#b8005d, 92), title="Low Band Fill")
//Bar Color
barcolor(use_barcolor ? bar_color : na)
//Plot Buy and Sell Labels
plotshape(longCondition, title = "Buy Signal", text ="BUY", textcolor = color.white, style=shape.labelup, size = size.normal, location=location.belowbar, color = color.new(color.green, 0))
plotshape(shortCondition, title = "Sell Signal", text ="SELL", textcolor = color.white, style=shape.labeldown, size = size.normal, location=location.abovebar, color = color.new(color.red, 0))
//Alerts
alertcondition(longCondition, title="Buy Alert", message = "BUY")
alertcondition(shortCondition, title="Sell Alert", message = "SELL")
Lógica de estrategia
Indicador EMA: La estrategia utiliza dos medias móviles EMA, una línea rápida (parámetro de ciclo pequeño) y una línea lenta (parámetro de ciclo grande). La función principal de la media móvil doble EMA es ayudarnos a determinar la dirección de las tendencias del mercado.
-
Arreglo largo
La línea rápida está encima de la línea lenta. -
Arreglo corto
La línea rápida está debajo de la línea lenta.
Indicador VuManChu Swing Free: el indicador VuManChu Swing Free se utiliza para enviar señales y luego se combina con otras condiciones para determinar si se debe realizar un pedido para operar. Desde el código fuente del indicador VuManChu Swing Free, podemos ver que la variable longCondition representa la señal de compra y la variable shortCondition representa la señal de venta. Estas dos variables se utilizarán al escribir las condiciones del pedido más adelante.
Ahora hablemos de las condiciones específicas que activan las señales comerciales de la estrategia:
-
Reglas para entrar en posiciones largas:
El precio de cierre de la línea K positiva debe estar por encima de la línea rápida EMA, los dos promedios móviles EMA deben estar en una disposición alcista (la línea rápida está por encima de la línea lenta) y el indicador VuManChu Swing Free debe mostrar una señal de compra. (longCondition es verdadero). Si se cumplen las tres condiciones, esta línea K es la línea K clave para ingresar a una posición larga, y el precio de cierre de esta línea K es la posición de entrada. -
Reglas para entrar en una posición corta (opuesta a una posición larga):
El precio de cierre de la vela negativa debe estar por debajo de la línea EMA rápida, los dos promedios móviles EMA deben estar en una posición corta (la línea rápida está debajo de la línea lenta) y el indicador VuManChu Swing Free debe mostrar una señal de venta (shortCondition). es cierto). Si se cumplen las tres condiciones, el precio de cierre de esta línea K es el punto de entrada para la venta en corto.
¿No es muy sencilla la lógica de trading? Dado que el vídeo original no especifica el método de toma de beneficios y de stop loss, el editor utilizará un método de toma de beneficios y de stop loss más moderado, utilizando un stop loss de punto fijo y un seguimiento tomar ganancias.
Diseño de código
Colocamos el código del indicador VuManChu Swing Free directamente en nuestro código de estrategia intacto.
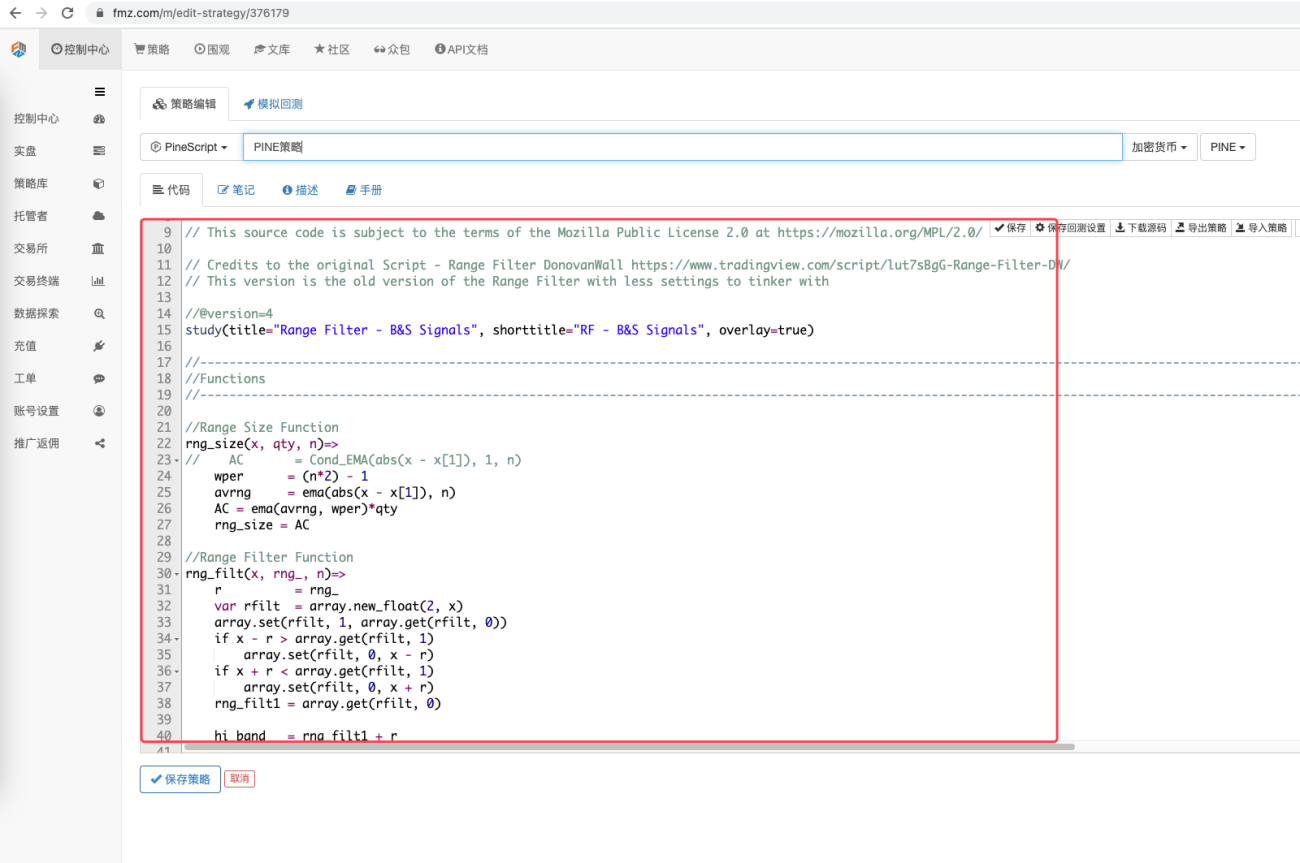
Luego escribimos un fragmento de código en lenguaje Pine para implementar la función de transacción:
pine
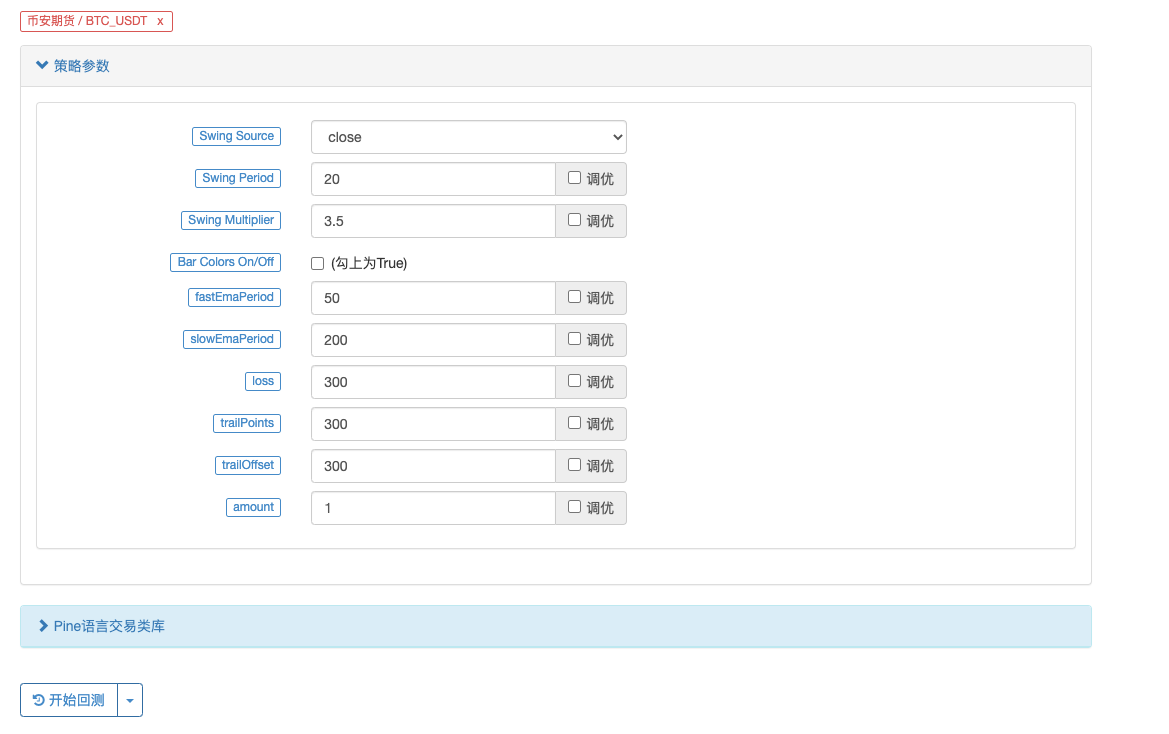
// extend
fastEmaPeriod = input(50, "fastEmaPeriod") // 快线周期
slowEmaPeriod = input(200, "slowEmaPeriod") // 慢线周期
loss = input(30, "loss") // 止损点数
trailPoints = input(30, "trailPoints") // 移动止盈触发点数
trailOffset = input(30, "trailOffset") // 移动止盈偏移量(点数)
amount = input(1, "amount") // 下单量
emaFast = ta.ema(close, fastEmaPeriod) // 计算快线EMA
emaSlow = ta.ema(close, slowEmaPeriod) // 计算慢线EMA
buyCondition = longCondition and emaFast > emaSlow and close > open and close > emaFast // 做多入场条件
sellCondition = shortCondition and emaFast < emaSlow and close < open and close < emaFast // 做空入场条件
if buyCondition and strategy.position_size == 0
strategy.entry("long", strategy.long, amount)
strategy.exit("exit_long", "long", amount, loss=loss, trail_points=trailPoints, trail_offset=trailOffset)
if sellCondition and strategy.position_size == 0
strategy.entry("short", strategy.short, amount)
strategy.exit("exit_short", "short", amount, loss=loss, trail_points=trailPoints, trail_offset=trailOffset)
A. Como puedes ver, cuando buyCondition es verdadero:
- La variable longCondition es verdadera (el indicador VuManChu Swing Free envía una señal para comprar).
- emaFast > emaSlow (disposición alcista de la EMA).
- cerrar > abrir (indicando que la BAR actual es una línea positiva), cerrar > emaFast (indicando que el precio de cierre está por encima de la línea rápida EMA).
Se cumplen las tres condiciones para ir en largo.
B. Cuando sellCondition es verdadero, se cumplen las tres condiciones para la venta en corto (no se explica aquí).
Luego, cuando la condición if determina que la señal se activa, utilice la función strategy.entry para ingresar al mercado y abrir una posición, y configure la función strategy.exit para detener la pérdida y la ganancia final.
Código completo
            pine

            /*backtest
start: 2022-01-01 00:00:00
end: 2022-10-08 00:00:00
period: 15m
basePeriod: 5m
exchanges: [{"eid":"Futures_Binance","currency":"ETH_USDT"}]
args: [["ZPrecision",0,358374]]
*/

// This source code is subject to the terms of the Mozilla Public License 2.0 at https://mozilla.org/MPL/2.0/

// Credits to the original Script - Range Filter DonovanWall https://www.tradingview.com/script/lut7sBgG-Range-Filter-DW/
// This version is the old version of the Range Filter with less settings to tinker with

//@version=4
study(title="Range Filter - B&S Signals", shorttitle="RF - B&S Signals", overlay=true)

//-----------------------------------------------------------------------------------------------------------------------------------------------------------------
//Functions
//-----------------------------------------------------------------------------------------------------------------------------------------------------------------

//Range Size Function
rng_size(x, qty, n)=>
//    AC       = Cond_EMA(abs(x - x[1]), 1, n)
    wper      = (n*2) - 1
    avrng     = ema(abs(x - x[1]), n)
    AC = ema(avrng, wper)*qty
    rng_size = AC

//Range Filter Function
rng_filt(x, rng_, n)=>
    r          = rng_
    var rfilt  = array.new_float(2, x)
    array.set(rfilt, 1, array.get(rfilt, 0))
    if x - r > array.get(rfilt, 1)
        array.set(rfilt, 0, x - r)
    if x + r < array.get(rfilt, 1)
        array.set(rfilt, 0, x + r)
    rng_filt1 = array.get(rfilt, 0)

    hi_band   = rng_filt1 + r
    lo_band   = rng_filt1 - r
    rng_filt  = rng_filt1
    [hi_band, lo_band, rng_filt]

//-----------------------------------------------------------------------------------------------------------------------------------------------------------------
//Inputs
//-----------------------------------------------------------------------------------------------------------------------------------------------------------------

//Range Source
rng_src = input(defval=close, type=input.source, title="Swing Source")

//Range Period
rng_per = input(defval=20, minval=1, title="Swing Period")

//Range Size Inputs
rng_qty   = input(defval=3.5, minval=0.0000001, title="Swing Multiplier")

//Bar Colors
use_barcolor = input(defval=false, type=input.bool, title="Bar Colors On/Off")

//-----------------------------------------------------------------------------------------------------------------------------------------------------------------
//Definitions
//-----------------------------------------------------------------------------------------------------------------------------------------------------------------

//Range Filter Values
[h_band, l_band, filt] = rng_filt(rng_src, rng_size(rng_src, rng_qty, rng_per), rng_per)

//Direction Conditions
var fdir = 0.0
fdir    := filt > filt[1] ? 1 : filt < filt[1] ? -1 : fdir
upward   = fdir==1 ? 1 : 0
downward = fdir==-1 ? 1 : 0

//Trading Condition
longCond = rng_src > filt and rng_src > rng_src[1] and upward > 0 or rng_src > filt and rng_src < rng_src[1] and upward > 0
shortCond = rng_src < filt and rng_src < rng_src[1] and downward > 0 or rng_src < filt and rng_src > rng_src[1] and downward > 0

CondIni = 0
CondIni := longCond ? 1 : shortCond ? -1 : CondIni[1]
longCondition = longCond and CondIni[1] == -1
shortCondition = shortCond and CondIni[1] == 1

//Colors
filt_color = upward ? #05ff9b : downward ? #ff0583 : #cccccc
bar_color  = upward and (rng_src > filt) ? (rng_src > rng_src[1] ? #05ff9b : #00b36b) :
             downward and (rng_src < filt) ? (rng_src < rng_src[1] ? #ff0583 : #b8005d) : #cccccc

//-----------------------------------------------------------------------------------------------------------------------------------------------------------------
//Outputs
//-----------------------------------------------------------------------------------------------------------------------------------------------------------------

//Filter Plot
filt_plot = plot(filt, color=filt_color, transp=67, linewidth=3, title="Filter")

//Band Plots
h_band_plot = plot(h_band, color=color.new(#05ff9b, 100), title="High Band")
l_band_plot = plot(l_band, color=color.new(#ff0583, 100), title="Low Band")

//Band Fills
fill(h_band_plot, filt_plot, color=color.new(#00b36b, 92), title="High Band Fill")
fill(l_band_plot, filt_plot, color=color.new(#b8005d, 92), title="Low Band Fill")

//Bar Color
barcolor(use_barcolor ? bar_color : na)

//Plot Buy and Sell Labels
plotshape(longCondition, title = "Buy Signal", text ="BUY", textcolor = color.white, style=shape.labelup, size = size.normal, location=location.belowbar, color = color.new(color.green, 0))
plotshape(shortCondition, title = "Sell Signal", text ="SELL", textcolor = color.white, style=shape.labeldown, size = size.normal, location=location.abovebar, color = color.new(color.red, 0))

//Alerts
alertcondition(longCondition, title="Buy Alert", message = "BUY")
alertcondition(shortCondition, title="Sell Alert", message = "SELL")


// extend
fastEmaPeriod = input(50, "fastEmaPeriod")
slowEmaPeriod = input(200, "slowEmaPeriod")
loss = input(30, "loss")
trailPoints = input(30, "trailPoints")
trailOffset = input(30, "trailOffset")
amount = input(1, "amount")

emaFast = ta.ema(close, fastEmaPeriod)
emaSlow = ta.ema(close, slowEmaPeriod)

buyCondition = longCondition and emaFast > emaSlow and close > open and close > emaFast
sellCondition = shortCondition and emaFast < emaSlow and close < open and close < emaFast

if buyCondition and strategy.position_size == 0
    strategy.entry("long", strategy.long, amount)
    strategy.exit("exit_long", "long", amount, loss=loss, trail_points=trailPoints, trail_offset=trailOffset)
if sellCondition and strategy.position_size == 0
    strategy.entry("short", strategy.short, amount)
    strategy.exit("exit_short", "short", amount, loss=loss, trail_points=trailPoints, trail_offset=trailOffset)
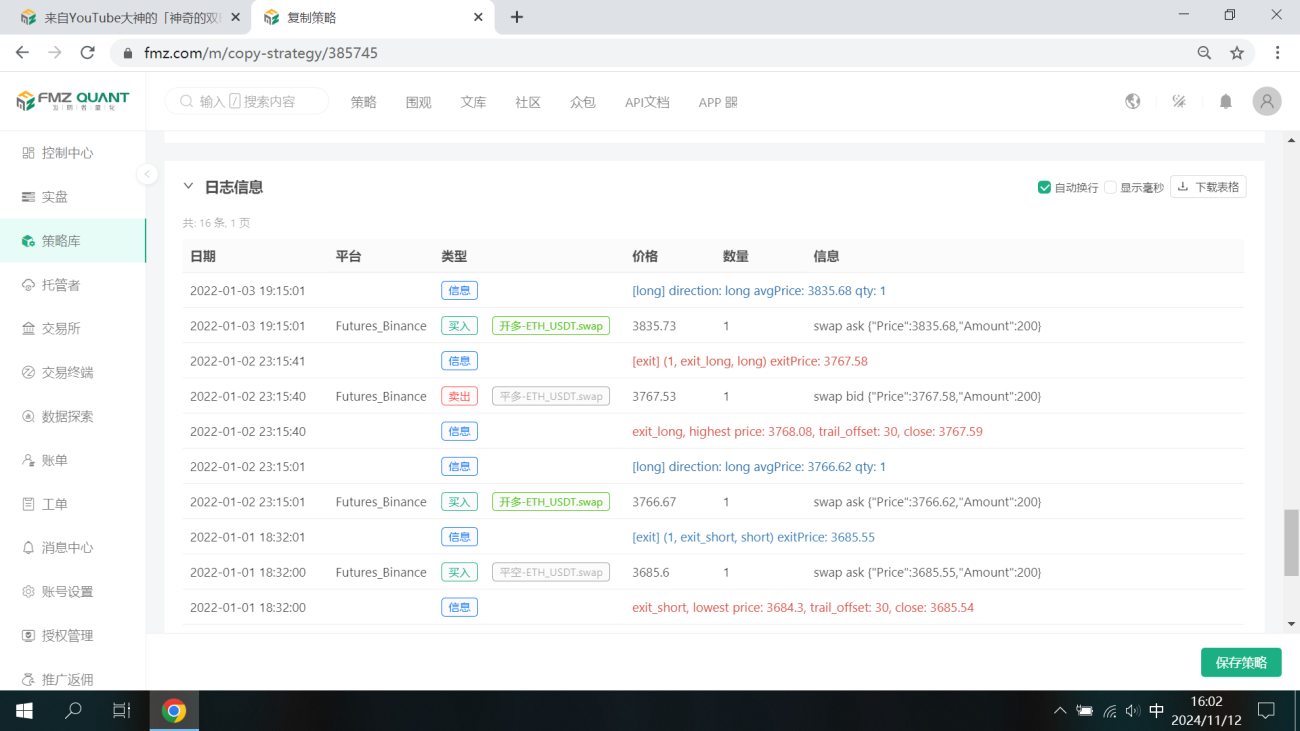
Prueba retrospectiva
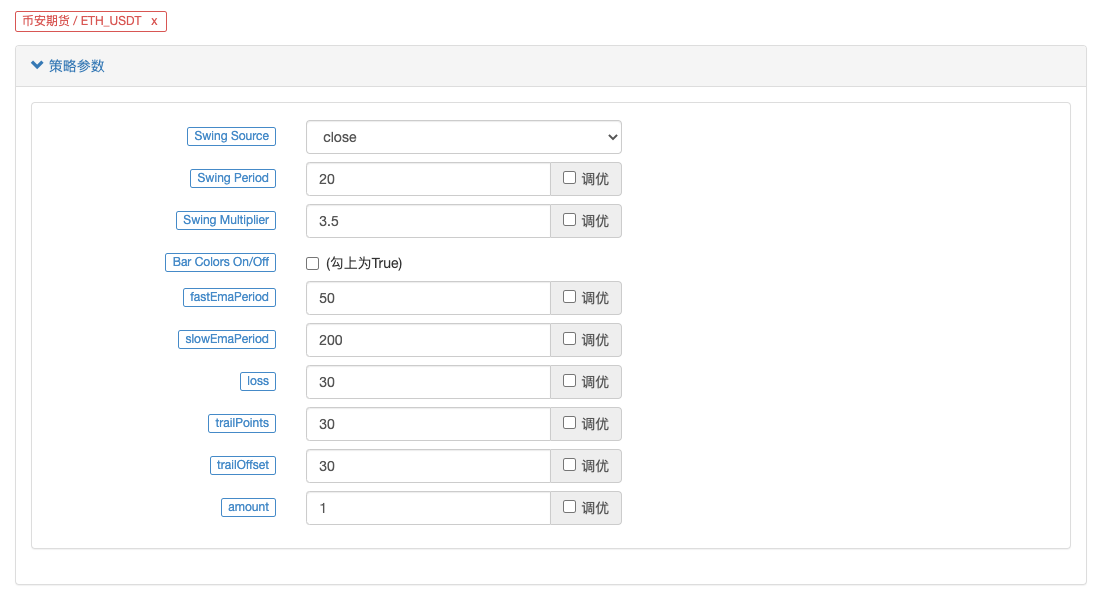
El rango de tiempo de backtesting se selecciona de enero de 2022 a octubre de 2022, el período de la línea K es de 15 minutos y el modelo de precio de cierre se utiliza para el backtesting. El mercado elige el contrato perpetuo ETH_USDT de Binance. Los ajustes de los parámetros son los que se indican en el video fuente: 50 períodos para la línea rápida y 200 períodos para la línea lenta, y los demás parámetros permanecen sin cambios de forma predeterminada. Soy un poco subjetivo al establecer los puntos de stop loss y trailing profit y los establezco en 30 puntos.
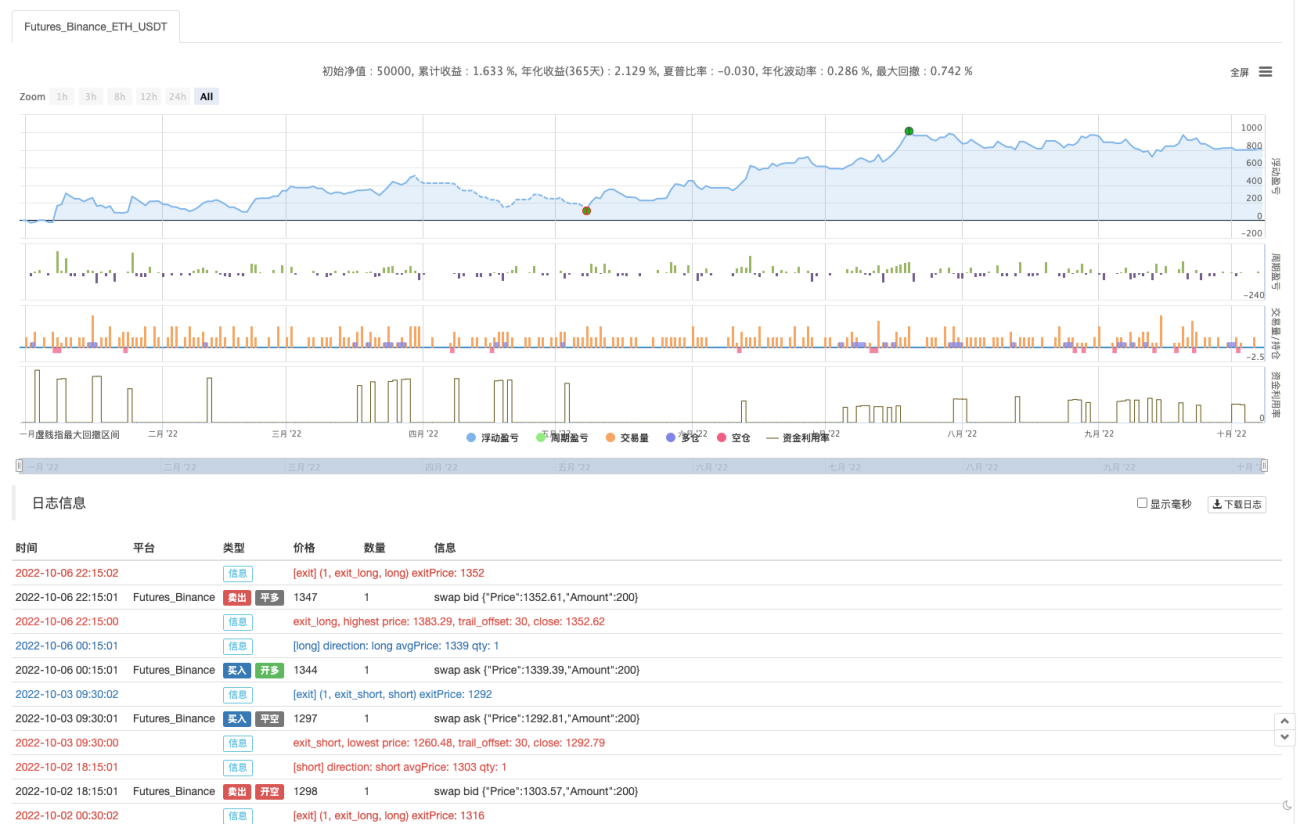
Los resultados de las pruebas retrospectivas son regulares. Después de varias pruebas retrospectivas, parece que parámetros como el take-profit y el stop-loss tienen algún impacto en los resultados de las pruebas retrospectivas. Considero que este aspecto necesita mayor optimización. Sin embargo, la tasa de ganancias sigue siendo buena después de que la señal de estrategia activa la transacción.
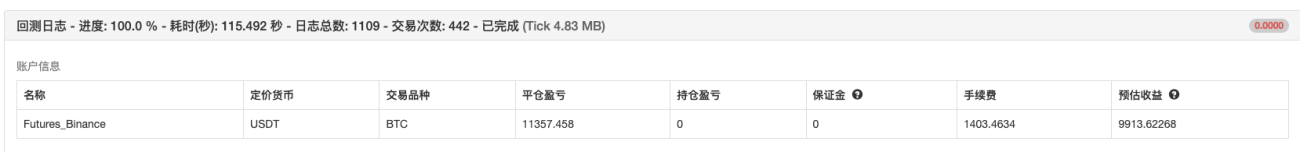
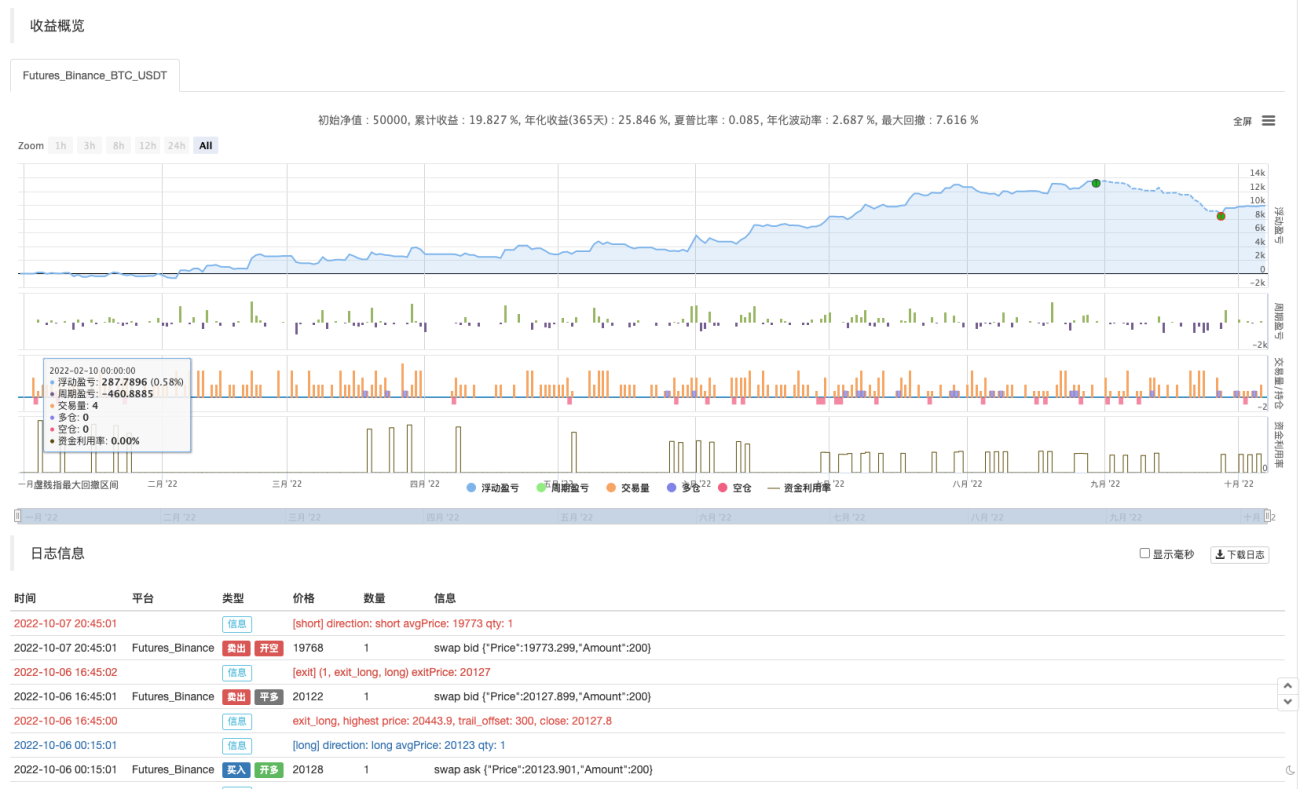
Probemos un contrato perpetuo BTC_USDT:
Los resultados del backtest en BTC también son explosivos:
Dirección de estrategia: https://www.fmz.com/strategy/385745
Parece que este método comercial es relativamente confiable para captar la tendencia y el diseño se puede optimizar aún más basándose en esta idea. En este artículo, no solo aprendimos la idea de una estrategia de doble media móvil, sino que también aprendimos cómo procesar y aprender las estrategias de los maestros en YouTube. Bien, los códigos de estrategia anteriores son solo mis sugerencias. Los resultados de las pruebas retrospectivas no representan los resultados reales específicos. Los códigos y diseños de estrategia son solo para referencia. Gracias por vuestro apoyo, ¡hasta la próxima!


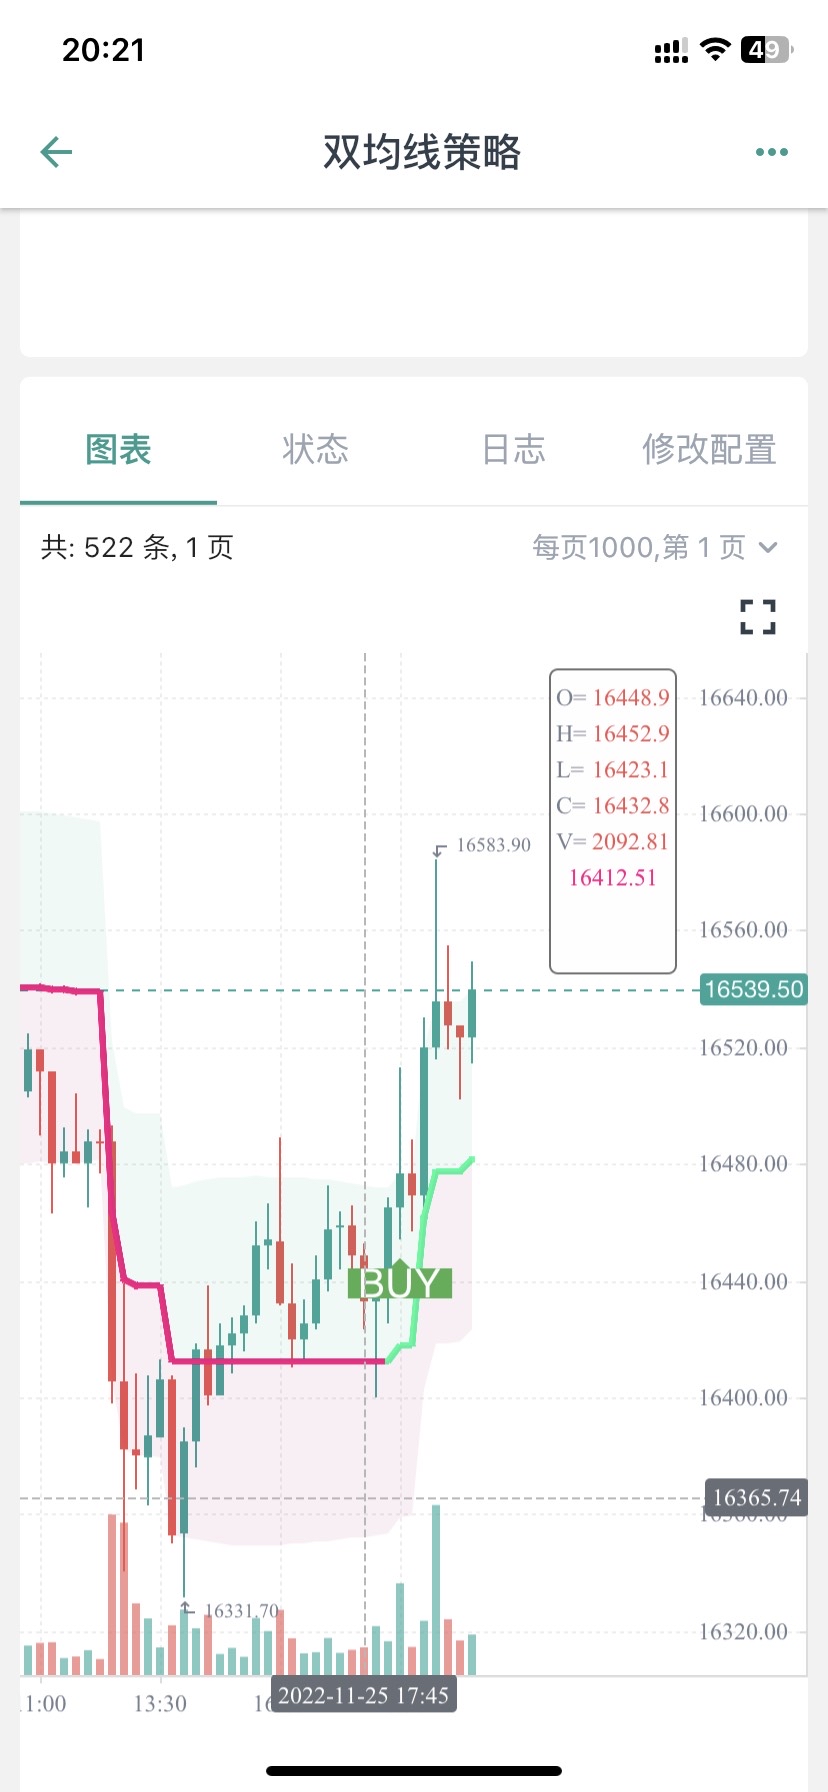


您好,这个是因为图表上显示的BUY标记只是文章中指标的信号显示,后面还结合了均线。
            //Plot Buy and Sell Labels
plotshape(longCondition, title = "Buy Signal", text ="BUY", textcolor = color.white, style=shape.labelup, size = size.normal, location=location.belowbar, color = color.new(color.green, 0))
plotshape(shortCondition, title = "Sell Signal", text ="SELL", textcolor = color.white, style=shape.labeldown, size = size.normal, location=location.abovebar, color = color.new(color.red, 0))
plotshape(longCondition, title = "Buy Signal", text ="BUY 画图显示时,只是longCondition条件符合了。
下单条件在这一块:
            if buyCondition and strategy.position_size == 0
    strategy.entry("long", strategy.long, amount)
    strategy.exit("exit_long", "long", amount, loss=loss, trail_points=trailPoints, trail_offset=trailOffset)
if sellCondition and strategy.position_size == 0
    strategy.entry("short", strategy.short, amount)
    strategy.exit("exit_short", "short", amount, loss=loss, trail_points=trailPoints, trail_offset=trailOffset)

梦大,建议从油管找两三个具有代表性的,改写难度较大,函数、参数、运算方式较多的策略做几个文字版的教程,比如带有类似【line.delete】这样的。(不需要策略盈利,就算是亏损的策略也无所谓,主要是用来学习写策略)。
我现在用这个双均线的策略,已经学会改一些不是非常复杂的组合策略了,改了十几个组合策略,其中有一两个确实是21年22年数据回测结果非常不错的,也已经在跑实盘测试了,但是遇到复杂函数参数运算这种【比如提示:line: 62 Could not find function or function reference 'line.delete',】而在FMZ PINE Script 文档并没有找到line.delete相关解释,用法说明,就懵圈了,所以希望梦大能弄点儿复杂策略改写一下,当然注释也多一些最好。就更方便学习了。[抱拳]
谢谢梦大。


梦大,请教下,PINE可以写复杂点儿的止盈方式吗?比如分层级止盈这样的???谢谢。
如果PINE可以和JS混编就好了,比如用PINE写指标,JS写交易部分就方便多了。。。。。
好的,谢谢梦大,另外请教下,PINE回测时间区间有限制吗?我选择2021年1月1日,到2022年10月11日,提示错误:
RuntimeError: abort(undefined) at Error at jsStackTrace (eval at self.onmessage (https://www.fmz.com/scripts/worker_detours.393054f7.js:1:147), <anonymous>:1:2096171) at stackTrace (eval at self.onmessage (https://www.fmz.com/scripts/worker_detours.393054f7.js:1:147), <anonymous>:1:2096345) at abort (eval at self.onmessage (https://www.fmz.com/scripts/worker_detours.393054f7.js:1:147), <anonymous>:1:2092408) at _abort (eval at self.onmessage (https://www.fmz.com/scripts/worker_detours.393054f7.js:1:147), <anonymous>:1:2137287) at <anonymous>:wasm-function[1297]:0x76bdc at <anonymous>:wasm-function[466]:0x3d789 at <anonymous>:wasm-function[477]:0x42e6b at <anonymous>:wasm-function[471]:0x4149e at <anonymous>:wasm-function[453]:0x3bf18 at <anonymous>:wasm-function[173]:0x13122
但是如果不改时间段就正常回测了。。。。 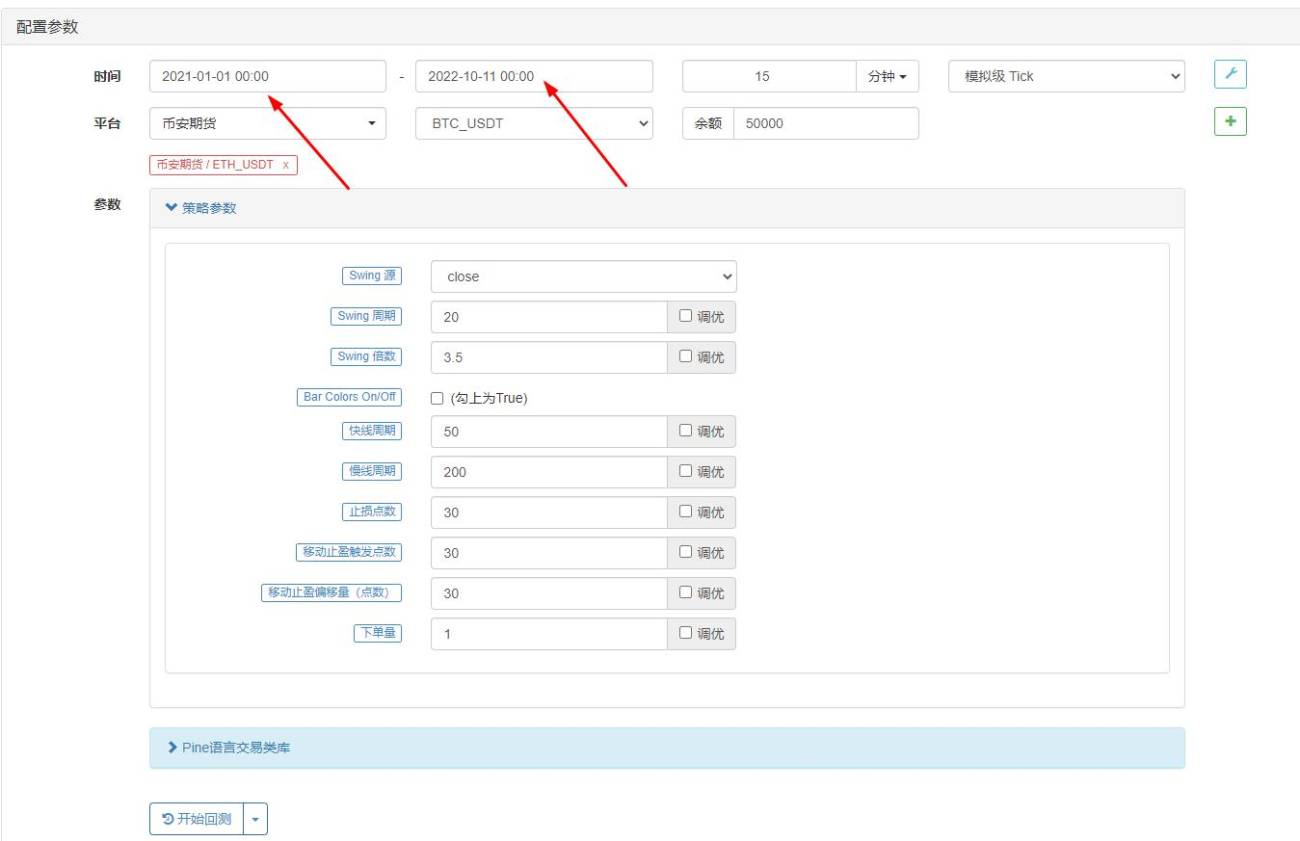

- 1