Estrategia de ruptura dinámica

Descripción general
Esta estrategia se utiliza principalmente para lograr la estrategia de seguimiento de la ruptura de la corredera de la cuenca de Dengxian. Esta estrategia combina la tendencia y la ruptura de dos ideas de comercio, en la base de la tendencia de la línea larga de juicio, la búsqueda de los puntos de ruptura de menor período para realizar entradas, la realización de la situación de la tendencia de la tendencia. Además, la estrategia también establece el nivel de pérdidas y paradas para controlar el riesgo-beneficio de cada transacción.
Principio de estrategia
-
Configuración de los parámetros para el indicador de la valvula de la vía de Deng Dongqian, con un ciclo por defecto de 20;
-
Configuración de la línea media móvil suave de la EMA, con un ciclo por defecto de 200;
-
La tasa de riesgo-beneficio es de 1.5 por defecto.
-
Configuración de los parámetros de retroceso de la ruptura, en forma de múltiples y sin cabeza;
-
Si el registro de una ruptura es alto o bajo;
-
Señales múltiples: si la ruptura anterior es baja y el precio está por encima de la línea superior de Dongguan y por encima de la línea media de la EMA, se genera una señal múltiple;
-
Señales de cabeza vacía: si la ruptura anterior es alta y el precio está por debajo de la línea descendente de Dongguan y por debajo de la línea media de la EMA, se genera una señal de cabeza vacía;
-
Después de entrar en una posición de múltiples cabezas, el stop loss se establece como una retirada de 5 puntos por debajo de la vía de Dongjian, y el stop loss es el riesgo por la ganancia multiplicado por la distancia de parada;
-
Después de entrar en la posición de cabeza vacía, el stop loss se establece como la retracción de 5 puntos en la vía superior de Dongjian, y el stop loss es el riesgo por la ganancia multiplicado por la distancia de parada.
De esta manera, la estrategia, combinada con el juicio de la tendencia y la operación de ruptura, puede capturar oportunidades de períodos más cortos en la tendencia de la línea larga. Al mismo tiempo, la configuración de stop loss puede controlar el riesgo de ganancias de una sola operación.
Análisis de las ventajas
-
En la actualidad, el comercio de divisas en el mercado de divisas está en pleno apogeo.
-
El canal de Dongxian es un indicador de línea larga que, en combinación con el filtro de línea uniforme de la EMA, permite determinar mejor la dirección de la tendencia.
-
El mecanismo de prevención de pérdidas controla cada riesgo y limita las posibles pérdidas.
-
Optimización de la relación riesgo-beneficio, que permite aumentar la relación pérdidas-ganancias y buscar ganancias extras.
-
La configuración de los parámetros de retroalimentación es flexible y permite ajustar la combinación óptima de parámetros para diferentes mercados.
Análisis de riesgos
-
El canal de Dongxian y la línea media de la EMA son indicadores de filtración y pueden emitir señales erróneas.
-
Las brechas son fácilmente manipulables y requieren una identificación clara del contexto de la tendencia.
-
El stop loss está fijado y no se puede ajustar según la volatilidad del mercado.
-
Parameters El espacio de optimización es limitado, y el disco duro es difícil de garantizar.
-
Los sistemas de negociación no pueden soportar demasiados eventos aleatorios, y los eventos de Black Swan pueden causar grandes pérdidas.
Dirección de optimización
-
Se puede considerar la adición de más indicadores para filtrar, como el indicador de vibración, para mejorar la calidad de la señal.
-
Se puede configurar un Stop Loss inteligente para ajustar la posición de pérdidas y ganancias en función de la volatilidad del mercado y la dinámica del indicador ATR.
-
Se pueden utilizar métodos como el aprendizaje automático para probar y optimizar los parámetros para que estén más cerca del mercado real.
-
Se puede optimizar la lógica de entrada, configurar un indicador de VOLUME o de fluctuación como condición auxiliar para evitar la trampa.
-
Se puede considerar la combinación con estrategias de seguimiento de tendencias o aprendizaje automático para formar estrategias mixtas y mejorar la estabilidad.
Resumir
Esta estrategia es una estrategia de seguimiento de ruptura, la idea central es determinar la tendencia de la línea larga, para hacer una operación de avance con la ruptura como señal, y establecer un stop loss para controlar el riesgo de una sola transacción. Esta estrategia tiene ciertas ventajas, pero también hay un espacio para la optimización. En general, si se puede manejar la configuración de los parámetros, la elección de la hora de entrada, y otros problemas complementarios con otras técnicas, esta estrategia puede ser una estrategia práctica de seguimiento de tendencias.
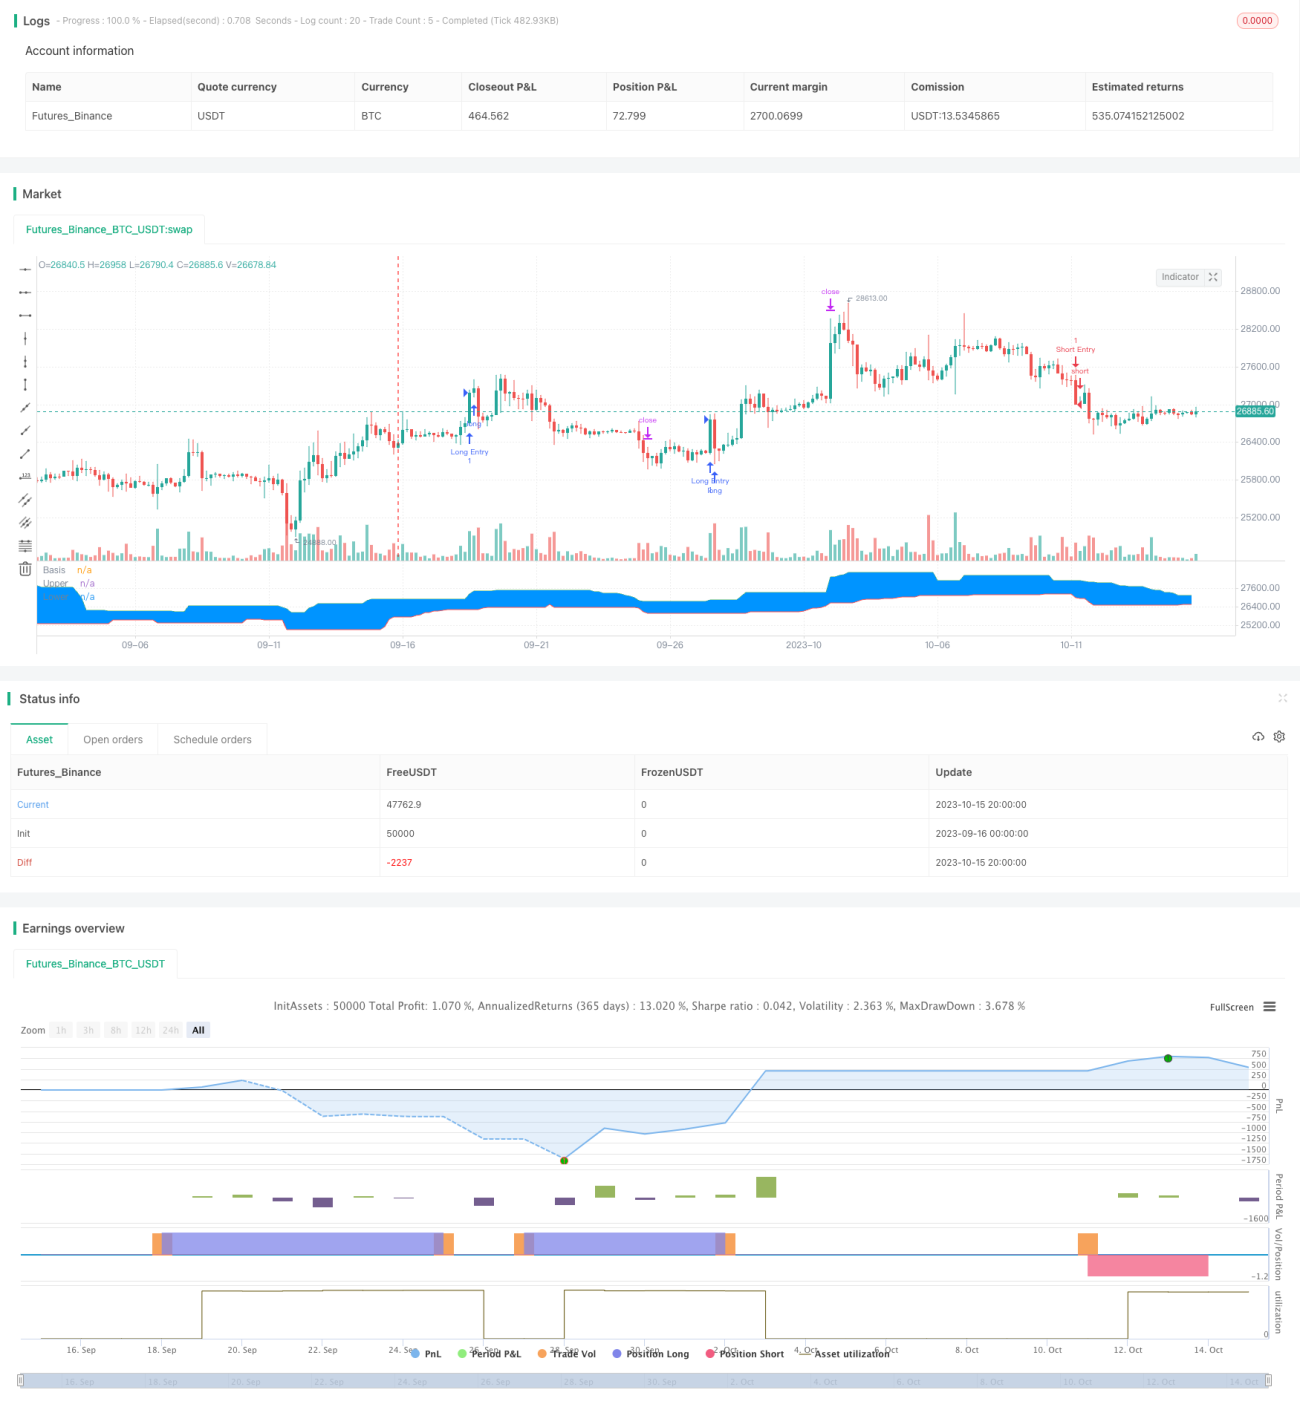
/*backtest
start: 2023-09-16 00:00:00
end: 2023-10-16 00:00:00
period: 4h
basePeriod: 15m
exchanges: [{"eid":"Futures_Binance","currency":"BTC_USDT"}]
*/

//@version=4
// Welcome to my second script on Tradingview with Pinescript
// First of, I'm sorry for the amount of comments on this script, this script was a challenge for me, fun one for sure, but I wanted to thoroughly go through every step before making the script public
// Glad I did so because I fixed some weird things and I ended up forgetting to add the EMA into the equation so our entry signals were a mess- 1