Estrategias comerciales cuantitativas de múltiples factores

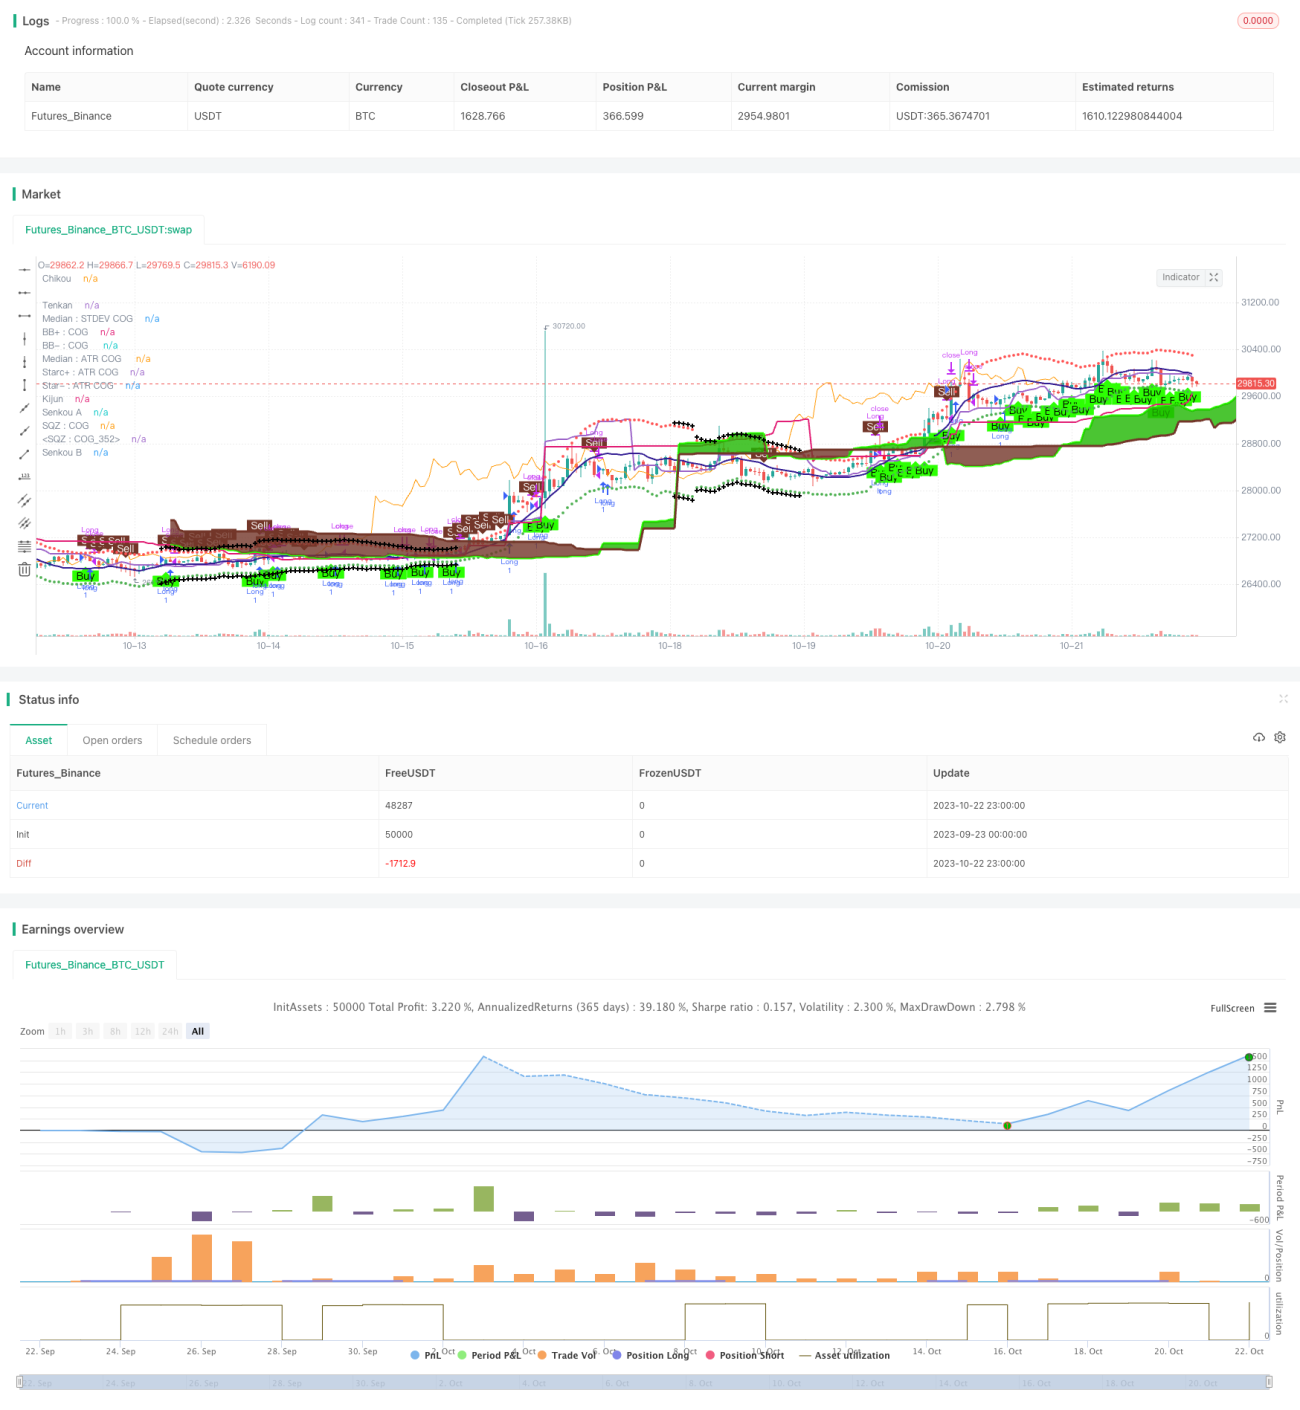
Se trata de una estrategia de trading cuantitativa que combina varios indicadores técnicos para tomar decisiones sobre el espacio libre. La estrategia considera de manera integral varios factores como el indicador de dinámica, el indicador de tendencia y el gráfico de la nube de Ichimoku para formar la decisión final de compra y venta. La estrategia tiene una gran estabilidad y resistencia al riesgo.
Análisis de principios
La estrategia se compone principalmente de las siguientes partes:
-
Indicadores de la dinámica: Parabolic SAR, el indicador de intensidad Leledc, el promedio móvil adaptado de Kaufman, etc.
-
Indicadores de tendencias: El agitador de Rahul Mohindar, el mágico de tendencias y más
-
Mapa de la nube de Ichimoku: incluye la línea Tenkan, la línea Kijun, etc.
-
Indicador de flujo de volumen
-
Indicador de fluctuaciones: Oscilador de tendencia de onda
-
Secuencias TD
Estos indicadores juzgan la tendencia y la fuerza del mercado actual desde diferentes ángulos. El SAR parabólico determina el punto de reversión de la tendencia, el indicador de fuerza Ledc determina el momento, el gráfico de la nube Ichimoku determina la presión de soporte.
La estrategia también establece condiciones de filtración para que las transacciones se realicen solo en el rango de fechas especificadas por mes y día, lo que reduce el número de transacciones no válidas.
Análisis de las ventajas
-
Juzgamiento integrado de múltiples factores, mayor precisión y mayor resistencia al riesgo
-
Utiliza diferentes tipos de indicadores para realizar una verificación cruzada y evitar el riesgo de fallo de un solo indicador
-
Establezca condiciones de filtro para evitar transacciones no válidas en períodos inadecuados
-
Escrito con Pine Script, es fácil y rápido de usar directamente en la plataforma TradingView
-
Los parámetros del indicador son ajustables y se pueden optimizar para diferentes mercados
-
Indicador de señales de visualización para intuir la estructura del mercado
Análisis de riesgos
-
La combinación de múltiples factores requiere ajustar los pesos y parámetros, con cierta dificultad de optimización.
-
El indicador único puede no funcionar en ciertas condiciones de mercado
-
Si las condiciones de filtración no son adecuadas, se puede perder una oportunidad.
-
Hay que tener cuidado de no optimizar demasiado.
-
Los comerciantes deben estar atentos a los riesgos de fallas en los indicadores y ajustar sus estrategias a tiempo
Respuesta:
-
Optimizar los parámetros de ajuste del indicador para que sean más efectivos para el mercado actual
-
Ajuste de peso para aumentar el papel de los indicadores efectivos y reducir el papel de los indicadores no efectivos
-
Ajuste de las condiciones de filtración a la vez que aprovecha las oportunidades y evita los riesgos
Optimización de las ideas
-
Agrega algoritmos de aprendizaje automático para ajustar el peso de los indicadores
-
Aumentar los indicadores de emoción, de flujo de capital y otros factores
-
Prueba de variedad de transacción, período de tiempo y configuración de parámetros óptimos
-
Prueba de la eficacia de diferentes tiempos de tenencia de posiciones
-
Combinación de más filtros, como datos estacionales y económicos
-
Añadir una estrategia de stop loss
Resumir
Esta estrategia integra varios indicadores para formar un juicio final, con una fuerte capacidad de resistencia al riesgo. Al mismo tiempo, también se debe prestar atención al riesgo de fallo de un solo indicador, optimización continua y ajuste de los parámetros. En el futuro, se puede optimizar aún más la configuración de las ponderaciones de los indicadores, agregar más factores, probar el período de tenencia de posición óptima, etc.
//@version=2
persistent_bull = nz(persistent_bull[1],0)
persistent_bear  = nz(persistent_bear[1],0)

strategy("Strategy for The Bitcoin Buy/Sell Indicator", overlay=true, calc_on_every_tick=true)

// ****************************************Inputs***************************************************************
//@fixme if there is a buy and sell signal on the same bar, then it displays the first one and skips the second one. Fix this issue
buySellSignal = true // Make this false if you do not want to show Buy/Sell signal
inputIndividualSiganlPlot = true // = input (false, "Do you want to display each individual indicator's signal on the chart?")
sp = input (false, "Do you want to display Parabolic SAR?")
spLines = input (false, "Do you want to display Parabolic SAR on the chart?")- 1