
La estrategia combina las ventajas de la estrategia de ruptura y la estrategia de seguimiento de tendencias para capturar las señales de ruptura de la resistencia de soporte en los gráficos de líneas largas y, al mismo tiempo, utiliza las medias móviles para el seguimiento de las rupturas de la resistencia, para obtener ganancias en la dirección de la tendencia de la línea larga y controlar el riesgo.
La estrategia comienza con el cálculo de las medias móviles de varios grupos de diferentes parámetros, que se utilizan para determinar tendencias, soportar resistencia y rastrear pérdidas respectivamente.
Luego se encuentran los puntos más altos y más bajos dentro del período especificado como las áreas de resistencia de soporte para entrar en juego. Cuando el precio rompe estas resistencias de soporte, se produce una señal.
La estrategia consiste en comprar con el punto más alto de la ruptura para hacer más señales y vender con el punto más bajo de la ruptura para hacer menos señales.
Después de entrar en el mercado, se mantiene la posición con el punto más bajo de la ruptura del mínimo como punto de parada.
Cuando la posición entra en estado de ganancia, el punto de parada se transfiere al seguimiento de la media móvil. Cuando el precio cae por debajo de la media móvil, el punto de parada se establece como el punto más bajo de la línea K de la raíz.
Así se puede bloquear el beneficio, mientras que la posición tiene suficiente espacio para seguir la tendencia.
Al mismo tiempo, la estrategia incluye la media de las fluctuaciones reales para asegurar que las compras de ruptura se realicen solo en el rango adecuado y evitar que la expansión excesiva se rompa.
La combinación de las estrategias de ruptura y la estrategia de seguimiento de la tendencia tiene la doble ventaja de la estrategia de stop loss.
En la actualidad, los inversores pueden comprar brechas en la tendencia de la línea larga para aumentar la probabilidad de obtener ganancias.
La estrategia de stop loss protege la posición y le da al mismo tiempo suficiente espacio para operar.
Se añade un filtro de fluctuación para evitar una ruptura desfavorable de la subida excesiva.
Automatización de las transacciones para el pago de cuentas a tiempo parcial.
Se puede personalizar la línea media de diferentes períodos.
El modo de seguimiento de la parada de pérdidas se puede ajustar con flexibilidad.
Las estrategias de penetración son propensas al riesgo de falsas penetraciones.
Se requiere suficiente fluctuación para generar una señal de ruptura, que es fácilmente invalidable en situaciones de subversión.
Algunas brechas pueden ser demasiado breves para ser capturadas. Se puede reducir la línea de tiempo para buscar más oportunidades.
El seguimiento de los estancamientos puede ser demasiado frecuente en situaciones de temblor. Se puede relajar adecuadamente la distancia de los estancamientos.
El filtro de fluctuación puede perder algunas oportunidades. Se puede reducir el parámetro de filtración.
Prueba diferentes combinaciones de parámetros de línea media para encontrar el mejor parámetro.
Prueba de diferentes mecanismos de confirmación de ruptura, tales como canales, formas de línea K, etc.
Prueba diferentes métodos de seguimiento de pérdidas para encontrar la mejor solución.
Optimización de las estrategias de gestión de fondos, como la puntuación de posición.
Se añade un filtro de indicadores técnicos estadísticos para mejorar la precisión del filtro.
Prueba la eficacia de esta estrategia en diferentes variedades.
La integración de algoritmos de aprendizaje automático mejora la eficacia de las estrategias.
La estrategia integra breakout thinking y trend tracking stop loss thinking para optimizar el espacio de ganancias, siempre y cuando se juzgue correctamente la línea larga. La clave es encontrar la combinación óptima de parámetros y trabajar con una buena estrategia de administración de fondos para aprovechar las oportunidades de la línea larga y al mismo tiempo lograr que el riesgo sea controlado. La estrategia tiene la posibilidad de convertirse en una estrategia de tendencia de la línea larga más confiable mediante una optimización adicional.
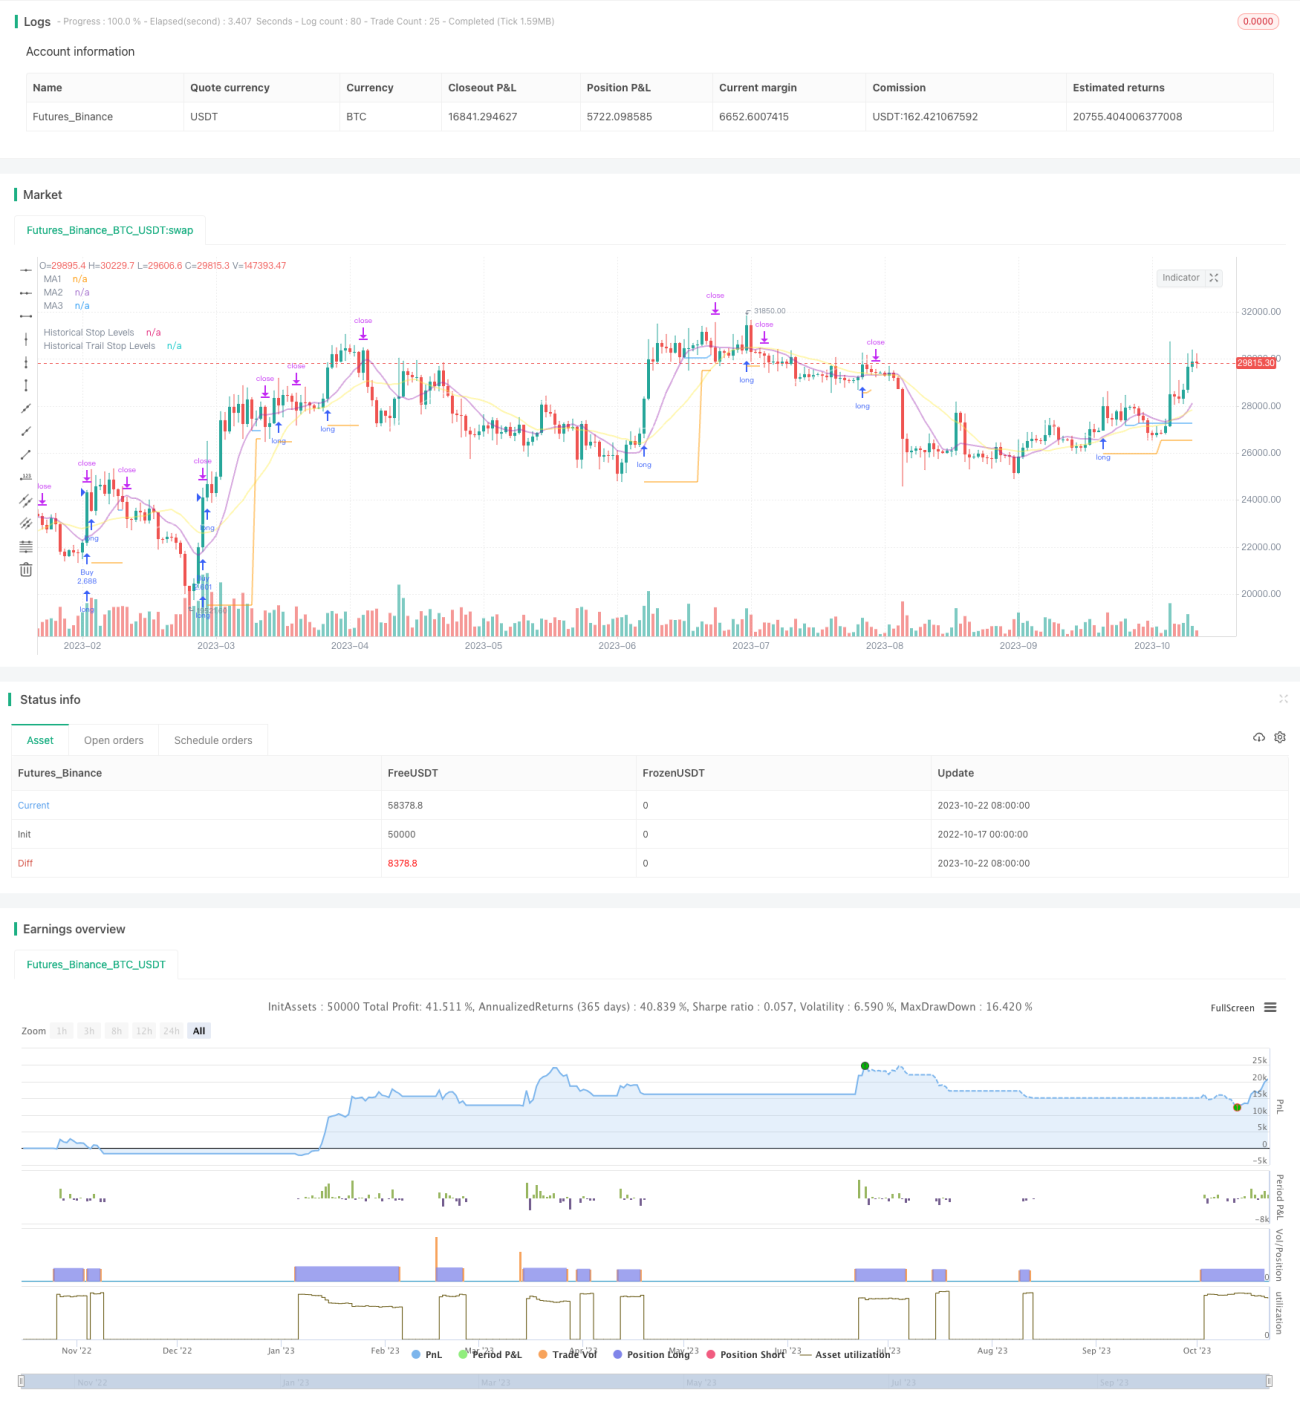
/*backtest
start: 2022-10-17 00:00:00
end: 2023-10-23 00:00:00
period: 1d
basePeriod: 1h
exchanges: [{"eid":"Futures_Binance","currency":"BTC_USDT"}]
*/
// This source code is subject to the terms of the Mozilla Public License 2.0 at https://mozilla.org/MPL/2.0/
// © millerrh
// The intent of this strategy is to buy breakouts with a tight stop on smaller timeframes in the direction of the longer term trend.
// Then use a trailing stop of a close below either the 10 MA or 20 MA (user choice) on that larger timeframe as the position
// moves in your favor (i.e. whenever position price rises above the MA).
// Option of using daily ADR as a measure of finding contracting ranges and ensuring a decent risk/reward.
// (If the difference between the breakout point and your stop level is below a certain % of ATR, it could possibly find those consolidating periods.)
// V2 - updates code of original Qullamaggie Breakout to optimize and debug it a bit - the goal is to remove some of the whipsaw and poor win rate of the
// original by incorporating some of what I learned in the Breakout Trend Follower script.
//@version=4
strategy("Qullamaggie Breakout V2", overlay=true, initial_capital=100000, currency='USD', calc_on_every_tick = true,
default_qty_type=strategy.percent_of_equity, default_qty_value=100, commission_type=strategy.commission.percent, commission_value=0.1)
// === BACKTEST RANGE ===
Start = input(defval = timestamp("01 Jan 2019 06:00 +0000"), title = "Backtest Start Date", type = input.time, group = "backtest window and pivot history")
Finish = input(defval = timestamp("01 Jan 2100 00:00 +0000"), title = "Backtest End Date", type = input.time, group = "backtest window and pivot history")
// Inputs
showPivotPoints = input(title = "Show Historical Pivot Points?", type = input.bool, defval = false, group = "backtest window and pivot history",
tooltip = "Toggle this on to see the historical pivot points that were used. Change the Lookback Periods to adjust the frequency of these points.")
htf = input(defval="D", title="Timeframe of Moving Averages", type=input.resolution, group = "moving averages",
tooltip = "Allows you to set a different time frame for the moving averages and your trailing stop.
The default behavior is to identify good tightening setups on a larger timeframe
(like daily) and enter the trade on a breakout occuring on a smaller timeframe, using the moving averages of the larger timeframe to trail your stop.")
maType = input(defval="SMA", options=["EMA", "SMA"], title = "Moving Average Type", group = "moving averages")
ma1Length = input(defval = 10, title = "1st Moving Average Length", minval = 1, group = "moving averages")
ma2Length = input(defval = 20, title = "2nd Moving Average Length", minval = 1, group = "moving averages")
ma3Length = input(defval = 50, title = "3rd Moving Average Length", minval = 1, group = "moving averages")
useMaFilter = input(title = "Use 3rd Moving Average for Filtering?", type = input.bool, defval = true, group = "moving averages",
tooltip = "Signals will be ignored when price is under this slowest moving average. The intent is to keep you out of bear periods and only
buying when price is showing strength or trading with the longer term trend.")
trailMaInput = input(defval="1st Moving Average", options=["1st Moving Average", "2nd Moving Average"], title = "Trailing Stop", group = "stops",
tooltip = "Initial stops after entry follow the range lows. Once in profit, the trade gets more wiggle room and
stops will be trailed when price breaches this moving average.")
trailMaTF = input(defval="Same as Moving Averages", options=["Same as Moving Averages", "Same as Chart"], title = "Trailing Stop Timeframe", group = "stops",
tooltip = "Once price breaches the trail stop moving average, the stop will be raised to the low of that candle that breached. You can choose to use the
chart timeframe's candles breaching or use the same timeframe the moving averages use. (i.e. if daily, you wait for the daily bar to close before setting
your new stop level.)")
currentColorS = input(color.new(color.orange,50), title = "Current Range S/R Colors: Support", type = input.color, group = "stops", inline = "lineColor")
currentColorR = input(color.new(color.blue,50), title = " Resistance", type = input.color, group = "stops", inline = "lineColor")
// Pivot lookback
lbHigh = 3
lbLow = 3
// MA Calculations (can likely move this to a tuple for a single security call!!)
ma(maType, src, length) =>
maType == "EMA" ? ema(src, length) : sma(src, length) //Ternary Operator (if maType equals EMA, then do ema calc, else do sma calc)
ma1 = security(syminfo.tickerid, htf, ma(maType, close, ma1Length))
ma2 = security(syminfo.tickerid, htf, ma(maType, close, ma2Length))
ma3 = security(syminfo.tickerid, htf, ma(maType, close, ma3Length))
plot(ma1, color=color.new(color.purple, 60), style=plot.style_line, title="MA1", linewidth=2)
plot(ma2, color=color.new(color.yellow, 60), style=plot.style_line, title="MA2", linewidth=2)
plot(ma3, color=color.new(color.white, 60), style=plot.style_line, title="MA3", linewidth=2)
// === USE ADR FOR FILTERING ===
// The idea here is that you want to buy in a consolodating range for best risk/reward. So here you can compare the current distance between
// support/resistance vs. the ADR and make sure you aren't buying at a point that is too extended.
useAdrFilter = input(title = "Use ADR for Filtering?", type = input.bool, defval = false, group = "adr filtering",
tooltip = "Signals will be ignored if the distance between support and resistance is larger than a user-defined percentage of ADR (or monthly volatility
in the stock screener). This allows the user to ensure they are not buying something that is too extended and instead focus on names that are consolidating more.")
adrPerc = input(defval = 120, title = "% of ADR Value", minval = 1, group = "adr filtering")
tableLocation = input(defval="Bottom", options=["Top", "Bottom"], title = "ADR Table Visibility", group = "adr filtering",
tooltip = "Place ADR table on the top of the pane, the bottom of the pane, or off.")
adrValue = security(syminfo.tickerid, "D", sma((high-low)/abs(low) * 100, 21)) // Monthly Volatility in Stock Screener (also ADR)
adrCompare = (adrPerc * adrValue) / 100
// === PLOT SWING HIGH/LOW AND MOST RECENT LOW TO USE AS STOP LOSS EXIT POINT ===
ph = pivothigh(high, lbHigh, lbHigh)
pl = pivotlow(low, lbLow, lbLow)
highLevel = valuewhen(ph, high[lbHigh], 0)
lowLevel = valuewhen(pl, low[lbLow], 0)
barsSinceHigh = barssince(ph) + lbHigh
barsSinceLow = barssince(pl) + lbLow
timeSinceHigh = time[barsSinceHigh]
timeSinceLow = time[barsSinceLow]
//Removes color when there is a change to ensure only the levels are shown (i.e. no diagonal lines connecting the levels)
pvthis = fixnan(ph)
pvtlos = fixnan(pl)
hipc = change(pvthis) != 0 ? na : color.new(color.maroon, 0)
lopc = change(pvtlos) != 0 ? na : color.new(color.green, 0)
// Display Pivot lines
plot(showPivotPoints ? pvthis : na, color=hipc, linewidth=1, offset=-lbHigh, title="Top Levels")
plot(showPivotPoints ? pvthis : na, color=hipc, linewidth=1, offset=0, title="Top Levels 2")
plot(showPivotPoints ? pvtlos : na, color=lopc, linewidth=1, offset=-lbLow, title="Bottom Levels")
plot(showPivotPoints ? pvtlos : na, color=lopc, linewidth=1, offset=0, title="Bottom Levels 2")
// BUY AND SELL CONDITIONS
buyLevel = valuewhen(ph, high[lbHigh], 0) //Buy level at Swing High
// Conditions for entry
stopLevel = float(na) // Define stop level here as "na" so that I can reference it in the ADR calculation before the stopLevel is actually defined.
buyConditions = (useMaFilter ? buyLevel > ma3 : true) and
(useAdrFilter ? (buyLevel - stopLevel[1]) < adrCompare : true)
buySignal = crossover(high, buyLevel) and buyConditions
// Trailing stop points - when price punctures the moving average, move stop to the low of that candle - Define as function/tuple to only use one security call
trailMa = trailMaInput == "1st Moving Average" ? ma1 : ma2
f_getCross() =>
maCrossEvent = crossunder(low, trailMa)
maCross = valuewhen(maCrossEvent, low, 0)
maCrossLevel = fixnan(maCross)
maCrossPc = change(maCrossLevel) != 0 ? na : color.new(color.blue, 0) //Removes color when there is a change to ensure only the levels are shown (i.e. no diagonal lines connecting the levels)
[maCrossEvent, maCross, maCrossLevel, maCrossPc]
crossTF = trailMaTF == "Same as Moving Averages" ? htf : ""
[maCrossEvent, maCross, maCrossLevel, maCrossPc] = security(syminfo.tickerid, crossTF, f_getCross())
plot(showPivotPoints ? maCrossLevel : na, color = maCrossPc, linewidth=1, offset=0, title="Ma Stop Levels")
// == STOP AND PRICE LEVELS ==
inPosition = strategy.position_size > 0
buyLevel := inPosition ? buyLevel[1] : buyLevel
stopDefine = valuewhen(pl, low[lbLow], 0) //Stop Level at Swing Low
inProfit = strategy.position_avg_price <= stopDefine[1]
// stopLevel := inPosition ? stopLevel[1] : stopDefine // Set stop loss based on swing low and leave it there
stopLevel := inPosition and not inProfit ? stopDefine : inPosition and inProfit ? stopLevel[1] : stopDefine // Trail stop loss until in profit
trailStopLevel = float(na)
// trying to figure out a better way for waiting on the trail stop - it can trigger if above the stopLevel even if the MA hadn't been breached since opening the trade
notInPosition = strategy.position_size == 0
inPositionBars = barssince(notInPosition)
maCrossBars = barssince(maCrossEvent)
trailCross = inPositionBars > maCrossBars
// trailCross = trailMa > stopLevel
trailStopLevel := inPosition and trailCross ? maCrossLevel : na
plot(inPosition ? stopLevel : na, style=plot.style_linebr, color=color.new(color.orange, 50), linewidth = 2, title = "Historical Stop Levels", trackprice=false)
plot(inPosition ? trailStopLevel : na, style=plot.style_linebr, color=color.new(color.blue, 50), linewidth = 2, title = "Historical Trail Stop Levels", trackprice=false)
// == PLOT SUPPORT/RESISTANCE LINES FOR CURRENT CHART TIMEFRAME ==
// Use a function to define the lines
// f_line(x1, y1, y2, _color) =>
// var line id = na
// line.delete(id)
// id := line.new(x1, y1, time, y2, xloc.bar_time, extend.right, _color)
// highLine = f_line(timeSinceHigh, highLevel, highLevel, currentColorR)
// lowLine = f_line(timeSinceLow, lowLevel, lowLevel, currentColorS)
// == ADR TABLE ==
tablePos = tableLocation == "Top" ? position.top_right : position.bottom_right
var table adrTable = table.new(tablePos, 2, 1, border_width = 3)
lightTransp = 90
avgTransp = 80
heavyTransp = 70
posColor = color.rgb(38, 166, 154)
negColor = color.rgb(240, 83, 80)
volColor = color.new(#999999, 0)
f_fillCellVol(_table, _column, _row, _value) =>
_transp = abs(_value) > 7 ? heavyTransp : abs(_value) > 4 ? avgTransp : lightTransp
_cellText = tostring(_value, "0.00") + "%\n" + "ADR"
table.cell(_table, _column, _row, _cellText, bgcolor = color.new(volColor, _transp), text_color = volColor, width = 6)
srDistance = (highLevel - lowLevel)/highLevel * 100
f_fillCellCalc(_table, _column, _row, _value) =>
_c_color = _value >= adrCompare ? negColor : posColor
_transp = _value >= adrCompare*0.8 and _value <= adrCompare*1.2 ? lightTransp :
_value >= adrCompare*0.5 and _value < adrCompare*0.8 ? avgTransp :
_value < adrCompare*0.5 ? heavyTransp :
_value > adrCompare*1.2 and _value <= adrCompare*1.5 ? avgTransp :
_value > adrCompare*1.5 ? heavyTransp : na
_cellText = tostring(_value, "0.00") + "%\n" + "Range"
table.cell(_table, _column, _row, _cellText, bgcolor = color.new(_c_color, _transp), text_color = _c_color, width = 6)
if barstate.islast
f_fillCellVol(adrTable, 0, 0, adrValue)
f_fillCellCalc(adrTable, 1, 0, srDistance)
// f_fillCellVol(adrTable, 0, 0, inPositionBars)
// f_fillCellCalc(adrTable, 1, 0, maCrossBars)
// == STRATEGY ENTRY AND EXIT ==
strategy.entry("Buy", strategy.long, stop = buyLevel, when = buyConditions)
stop = stopLevel > trailStopLevel ? stopLevel : close[1] > trailStopLevel and close[1] > trailMa ? trailStopLevel : stopLevel
strategy.exit("Sell", from_entry = "Buy", stop=stop)