Estrategia de trading de línea


Fecha de creación: 2023-11-02 14:14:34 Última modificación: 2023-11-02 14:14:34
Copiar: 0 Número de Visitas: 611
1
Seguir
1617
Seguidores

Estrategia de trading de línea

Descripción general

La estrategia se basa en la idea de romper soportes y resistencias clave, identificando las líneas de tendencia ascendente y descendente clave en los gráficos de precios y operando cuando los precios rompen las líneas de tendencia. La estrategia es simple y confiable y se aplica en un entorno de mercado en el que la tendencia es clara.

Principio de estrategia

La estrategia identifica los puntos clave de subida y bajada de los precios mediante el cálculo de los puntos altos y bajos de las líneas columnares a la izquierda y a la derecha para obtener líneas de soporte y de presión. Específicamente:

  1. usarpivothigh()ypivotlow()La función detecta los puntos altos y bajos clave.

  2. La ecuación de la línea de soporte y la línea de presión se dibuja en función de los puntos altos y bajos.

  3. Cuando el precio rompe la línea de presión, haga más; cuando el precio rompe la línea de soporte, haga vacío.

  4. Se puede elegir entre hacer más o hacer menos según la tendencia.

  5. Se puede elegir si se cambia de posición directa al momento de la ruptura.

  6. Se puede optar por el uso de stop loss, stop stop y trail loss.

  7. Se puede elegir el stop de punto de swing, stop de ATR y stop fijo.

La estrategia es sencilla y práctica para romper las operaciones a través de un simple indicador de tendencia, combinando seguimiento de tendencia y reversión de tendencia.

Análisis de las ventajas

  • Las estrategias son simples, fáciles de entender y de implementar.
  • El uso de Breakthrough Theory tiene una cierta ventaja de probabilidad.
  • Se puede configurar el Stop Loss Stop para controlar el riesgo.
  • Se puede hacer un seguimiento de la tendencia o una inversión de la tendencia.
  • Parámetros optimizados para diferentes entornos de mercado.

Análisis de riesgos

  • La señal de ruptura podría haber sido falsa.
  • La configuración incorrecta de los puntos de parada puede aumentar las pérdidas.
  • La operación de reversión conlleva el riesgo de ser engañada.
  • El ajuste de parámetros requiere experiencia y puede fallar si no se ajusta correctamente.
  • La ruptura de una tendencia pura no se aplica a las perturbaciones.

Se puede reducir el riesgo mediante la optimización de las estrategias de detención de pérdidas, la evaluación de la calidad de la señal de ruptura y la evaluación del tiempo de reversión.

Dirección de optimización

  • Evaluar la fiabilidad de las señales de ruptura y mejorar su precisión.
  • La combinación de volume y amplificación de la señal de ruptura.
  • Optimizar las estrategias de stop loss para adaptarse a las fluctuaciones del mercado.
  • Evaluar el mejor momento para revertir.
  • parameter tuning。
  • Evaluar el modelo multifactorial.
  • Evaluación en combinación con otros indicadores.

Resumir

La estrategia es sencilla y práctica en general, captura tendencias de precios a través de brechas de tendencia simples, riesgos controlables. La estrategia se puede optimizar en muchos aspectos, se aplica a más situaciones de mercado, y en general es una estrategia de seguimiento de tendencias muy práctica.
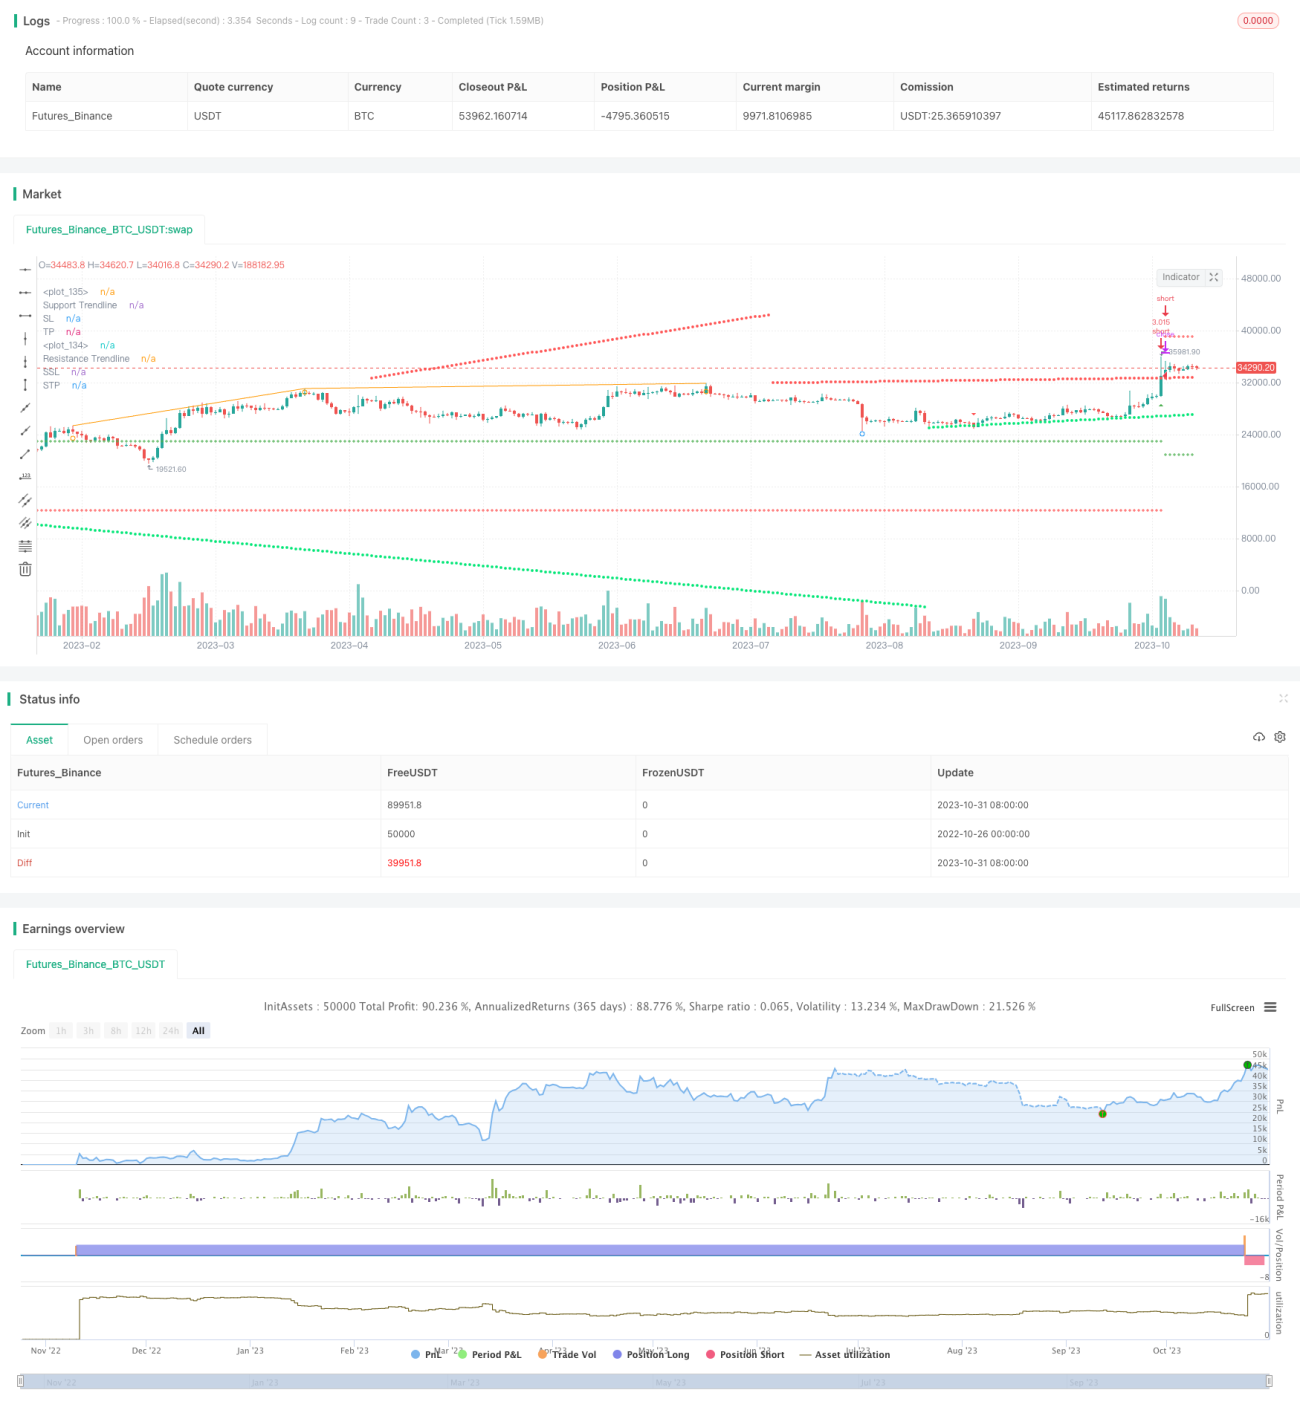
Código Fuente de la Estrategia
/*backtest
start: 2022-10-26 00:00:00
end: 2023-11-01 00:00:00
period: 1d
basePeriod: 1h
exchanges: [{"eid":"Futures_Binance","currency":"BTC_USDT"}]
*/

// This source code is subject to the terms of the Mozilla Public License 2.0 at https://mozilla.org/MPL/2.0/
// © tweakerID and © BacktestRookies

// Using the clever calculations and code by BacktestRookies, here is a strategy that buys 
// when the price breaks above a trendline and sells (or shorts) when it crosses below. 
// This logic can be reversed, which seems to work better with recent market conditions.

//@version=4
strategy("Trendlines Strategy", 
     overlay=true, 
     default_qty_type=strategy.percent_of_equity, 
     default_qty_value=100, 
     initial_capital=10000, 
     commission_value=0.04, 
     calc_on_every_tick=false, 
     slippage=0)

direction = input(0, title = "Strategy Direction", type=input.integer, minval=-1, maxval=1)
strategy.risk.allow_entry_in(direction == 0 ? strategy.direction.all : 
 (direction < 0 ? strategy.direction.short : strategy.direction.long))

// Bought and Sold Boolean Signal
bought = strategy.position_size > strategy.position_size[1] 
 or strategy.position_size < strategy.position_size[1]

/////////////////////// STRATEGY INPUTS ////////////////////////////////////////
title1=input(true, "-----------------Strategy Inputs-------------------")  

leftbars = input(100, minval=1, title='Pivot Detection: Left Bars')
rightbars = input(15, minval=1, title='Pivot Detection: Right Bars')
plotpivots = input(true, title='Plot Pivots')

/////////////////////// BACKTESTER /////////////////////////////////////////////
title2=input(true, "-----------------General Inputs-------------------")  

// Backtester General Inputs
i_SL=input(true, title="Use Stop Loss and Take Profit")
TS=input(false, title="Use Trailing Stop")
i_SLType=input(defval="ATR Stop", title="Type Of Stop", options=["Strategy Stop", "Swing Lo/Hi", "ATR Stop"])
i_SPL=input(defval=10, title="Swing Point Lookback")
i_PercIncrement=input(defval=3, step=.1, title="Swing Point SL Perc Increment")*0.01
i_ATR = input(14, title="ATR Length")
i_ATRMult = input(4, step=.1, title="ATR Multiple")
i_TPRRR = input(2, step=.1, title="Take Profit Risk Reward Ratio")
DPR=input(true, "Allow Direct Position Reverse")
reverse=input(true, "Reverse Trades")

// Swing Points Stop and Take Profit
SwingStopProfit() =>
    LL=(lowest(i_SPL))*(1-i_PercIncrement)
    HH=(highest(i_SPL))*(1+i_PercIncrement)
    LL_price = valuewhen(bought, LL, 0)
    HH_price = valuewhen(bought, HH, 0)
    entry_LL_price = strategy.position_size > 0 ? LL_price : na 
    entry_HH_price = strategy.position_size < 0 ? HH_price : na 
    tp=strategy.position_avg_price + (strategy.position_avg_price - entry_LL_price)*i_TPRRR
    stp=strategy.position_avg_price - (entry_HH_price - strategy.position_avg_price)*i_TPRRR
    [entry_LL_price, entry_HH_price, tp, stp]

// ATR Stop
ATRStop() =>
    ATR=atr(i_ATR)*i_ATRMult
    ATRLong = ohlc4 - ATR
    ATRShort = ohlc4 + ATR
    ATRLongStop = valuewhen(bought, ATRLong, 0)
    ATRShortStop = valuewhen(bought, ATRShort, 0)
    LongSL_ATR_price = strategy.position_size > 0 ? ATRLongStop : na 
    ShortSL_ATR_price = strategy.position_size < 0 ? ATRShortStop : na 
    ATRtp=strategy.position_avg_price + (strategy.position_avg_price - LongSL_ATR_price)*i_TPRRR
    ATRstp=strategy.position_avg_price - (ShortSL_ATR_price - strategy.position_avg_price)*i_TPRRR
    [LongSL_ATR_price, ShortSL_ATR_price, ATRtp, ATRstp]
    
// Strategy Stop
StrategyStop(bought) =>
    float LongStop = na
    float ShortStop = na
    float StratTP = na
    float StratSTP = na
    [LongStop, ShortStop, StratTP, StratSTP]

//TrailingStop
TrailingStop(SL,SSL) =>
    dif=(valuewhen(strategy.position_size>0 and strategy.position_size[1]<=0, high,0))
     -strategy.position_avg_price
    trailOffset     = strategy.position_avg_price - SL
    var tstop = float(na)
    if strategy.position_size > 0
        tstop := high- trailOffset - dif
        if tstop<tstop[1]
            tstop:=tstop[1]
    else
        tstop := na
    StrailOffset     = SSL - strategy.position_avg_price
    var Ststop = float(na)
    Sdif=strategy.position_avg_price-(valuewhen(strategy.position_size<0 
     and strategy.position_size[1]>=0, low,0))
    if strategy.position_size < 0
        Ststop := low+ StrailOffset + Sdif
        if Ststop>Ststop[1]
            Ststop:=Ststop[1]
    else
        Ststop := na
    [tstop, Ststop]
  
//Stop Loss & Take Profit Switches  
SLTPLogic(LongStop, ShortStop, StratTP, StratSTP, LongSL_ATR_price, ShortSL_ATR_price, ATRtp, ATRstp,
 entry_LL_price, entry_HH_price, tp, stp) =>
    SL= i_SLType == "Swing Lo/Hi" ? entry_LL_price : i_SLType == "ATR Stop" ? LongSL_ATR_price : LongStop
    SSL= i_SLType == "Swing Lo/Hi" ? entry_HH_price : i_SLType == "ATR Stop" ? ShortSL_ATR_price : ShortStop
    TP= i_SLType == "Swing Lo/Hi" ? tp : i_SLType == "ATR Stop" ? ATRtp : StratTP
    STP= i_SLType == "Swing Lo/Hi" ? stp : i_SLType == "ATR Stop" ? ATRstp : StratSTP
    [SL, SSL, TP, STP]


/////////////////////// STRATEGY LOGIC /////////////////////////////////////////

// Pivots
ph = pivothigh(high, leftbars, rightbars)
pl = pivotlow(low, leftbars, rightbars)

phv1 = valuewhen(ph, high[rightbars], 0)
phb1 = valuewhen(ph, bar_index[rightbars], 0)
phv2 = valuewhen(ph, high[rightbars], 1)
phb2 = valuewhen(ph, bar_index[rightbars], 1)

plv1 = valuewhen(pl, low[rightbars], 0)
plb1 = valuewhen(pl, bar_index[rightbars], 0)
plv2 = valuewhen(pl, low[rightbars], 1)
plb2 = valuewhen(pl, bar_index[rightbars], 1)
    
plotshape(ph, style=shape.circle, location=location.abovebar, color=color.orange,  title='Pivot High', offset=-rightbars)
plotshape(pl, style=shape.circle,   location=location.belowbar, color=color.blue, title='Pivot Low',  offset=-rightbars)

plot(ph ? high[rightbars] : na, color=color.orange, offset=-rightbars)
plot(pl ? low[rightbars] : na, color=color.purple, offset=-rightbars)

// TRENDLINE CODE
// --------------
get_slope(x1,x2,y1,y2)=>
    m = (y2-y1)/(x2-x1)
 
get_y_intercept(m, x1, y1)=>
    b=y1-m*x1

get_y(m, b, ts)=>
    Y = m * ts + b


int   res_x1 = na
float res_y1 = na
int   res_x2 = na
float res_y2 = na

int   sup_x1 = na
float sup_y1 = na
int   sup_x2 = na
float sup_y2 = na


// Resistance
res_x1 := ph ? phb1 : res_x1[1]
res_y1 := ph ? phv1 : res_y1[1]
res_x2 := ph ? phb2 : res_x2[1]
res_y2 := ph ? phv2 : res_y2[1]

res_m = get_slope(res_x1,res_x2,res_y1,res_y2)
res_b = get_y_intercept(res_m, res_x1, res_y1)
res_y = get_y(res_m, res_b, bar_index)

// Support
sup_x1 := pl ? plb1 : sup_x1[1]
sup_y1 := pl ? plv1 : sup_y1[1]
sup_x2 := pl ? plb2 : sup_x2[1]
sup_y2 := pl ? plv2 : sup_y2[1]

sup_m = get_slope(sup_x1,sup_x2,sup_y1,sup_y2)
sup_b = get_y_intercept(sup_m, sup_x1, sup_y1)
sup_y = get_y(sup_m, sup_b, bar_index)


// plot(line.get_y2(line1))
plot(res_y, color=color.red, title='Resistance Trendline', linewidth=2, style=plot.style_circles)
plot(sup_y, color=color.lime, title='Support Trendline', linewidth=2, style=plot.style_circles)

// if ph
//     line.new(phb1,phv1, bar_index, res_y, style=line.style_dashed, color=color.blue)
    
// if pl
//     line.new(plb1,plv1, bar_index, sup_y, style=line.style_dashed, color=color.blue)
    
// Breaks
long_break = crossover(close, res_y)
short_break = crossunder(close, sup_y)
plotshape(long_break,  style=shape.triangleup, color=color.green, size=size.tiny, location=location.belowbar, title='Long Break')
plotshape(short_break, style=shape.triangledown, color=color.red, size=size.tiny, location=location.abovebar, title='Short Break')

BUY=long_break
SELL=short_break

/////////////////////// FUNCTION CALLS /////////////////////////////////////////

// Stops and Profits
[entry_LL_price, entry_HH_price, tp, stp] = SwingStopProfit()
[LongSL_ATR_price, ShortSL_ATR_price, ATRtp, ATRstp] = ATRStop()
[LongStop, ShortStop, StratTP, StratSTP] = StrategyStop(bought)
[SL, SSL, TP, STP] = SLTPLogic(LongStop, ShortStop, StratTP, StratSTP, 
 LongSL_ATR_price, ShortSL_ATR_price, ATRtp, ATRstp, entry_LL_price, entry_HH_price, tp, stp)
[tstop, Ststop] = TrailingStop(SL,SSL)

// Entries
if reverse
    if not DPR
        strategy.entry("long", strategy.long, when=SELL and strategy.position_size == 0)
        strategy.entry("short", strategy.short, when=BUY and strategy.position_size == 0)
    else     
        strategy.entry("long", strategy.long, when=SELL)
        strategy.entry("short", strategy.short, when=BUY)
else
    if not DPR 
        strategy.entry("long", strategy.long, when=BUY and strategy.position_size == 0)
        strategy.entry("short", strategy.short, when=SELL and strategy.position_size == 0)
    else
        strategy.entry("long", strategy.long, when=BUY)
        strategy.entry("short", strategy.short, when=SELL)
// Exits
if i_SL
    strategy.exit("TP & SL", "long", limit=TP, stop=TS? tstop : SL)
    strategy.exit("TP & SL", "short", limit=STP, stop=TS? Ststop : SSL)

/////////////////////// PLOTS //////////////////////////////////////////////////

plot(i_SL and strategy.position_size > 0 and not TS ? SL : i_SL and 
 strategy.position_size > 0 and TS ? tstop : na , title='SL', style=plot.style_cross, color=color.red)
plot(i_SL and strategy.position_size < 0 and not TS ? SSL : i_SL and 
 strategy.position_size < 0 and TS ? Ststop : na , title='SSL', style=plot.style_cross, color=color.red)
plot(i_SL and strategy.position_size > 0 ? TP : na, title='TP', style=plot.style_cross, color=color.green)
plot(i_SL and strategy.position_size < 0 ? STP : na, title='STP', style=plot.style_cross, color=color.green)

// Draw price action setup arrows
plotshape(BUY ? 1 : na, style=shape.triangleup, location=location.belowbar, 
 color=color.green, title="Bullish Setup", size=size.auto)
plotshape(SELL ? 1 : na, style=shape.triangledown, location=location.abovebar, 
 color=color.red, title="Bearish Setup", size=size.auto)