Estrategia optimizada de cruce de medias móviles exponenciales EMAC

Resumen
La estrategia optimizada de cruce de medias móviles exponenciales (EMAC) es una versión mejorada de la estrategia EMAC básica, que incorpora la identificación de tendencias, el filtrado de múltiples medias móviles y salidas con stop loss y take profit. Su objetivo es seguir las tendencias de mediano a largo plazo.
Principio de la estrategia
-
Identificar la dirección de la tendencia reciente: calcular el cambio porcentual del precio de cierre en los últimos 26 periodos, clasificándolo como alcista, bajista o de rango lateral.
-
Filtrado de múltiples medias móviles: calcular las EMA de 10, 20 y 34 periodos. Se genera una señal de compra cuando todas cruzan al alza la SMA de 50 periodos.
-
Stop loss basado en ATR: al aparecer la señal de entrada, el stop loss se sitúa en el mínimo de la barra de entrada o en el precio de entrada menos 2.5 ATR.
-
Stop loss dinámico: a medida que el precio sube, la línea de stop loss se desplaza gradualmente al alza.
-
Take profit objetivo: al aparecer la señal de entrada, se establece un objetivo de ganancias igual al precio de cierre actual más 3 ATR.
-
Salida por retroceso a la media móvil: si el precio retrocede por debajo de la EMA de 10 periodos, se cierra la posición activamente.
Ventajas de la estrategia
-
El filtrado de múltiples medias móviles aumenta la fiabilidad de las señales, evitando señales falsas provocadas por rupturas engañosas.
-
El uso del stop loss basado en ATR permite establecer una distancia de stop acorde a la volatilidad del mercado.
-
El stop loss dinámico sube gradualmente la línea de stop, protegiendo parte de las ganancias.
-
El take profit objetivo establece una meta de ganancias razonable, evitando la codicia y la pérdida de beneficios.
-
La salida por retroceso de la media móvil permite detener las pérdidas a tiempo cuando la tendencia se revierte.
Riesgos de la estrategia y soluciones
-
En mercados laterales, las EMA pueden cruzarse repetidamente, generando pérdidas consecutivas. Se puede aumentar el periodo de las EMA o añadir un filtro adicional de cruce dorado de medias para reducir esta probabilidad.
-
Cuando el valor del ATR es elevado, la distancia del stop loss puede ser demasiado amplia, aumentando el riesgo de pérdidas. Se recomienda usar una media móvil del ATR o aplicar un factor de reducción al ATR.
-
No se considera el riesgo de gaps nocturnos. Se puede incluir una lógica que evite señales durante los periodos en que el mercado está cerrado.
-
No se tiene en cuenta el estado del mercado general. Se puede añadir un filtro que evalúe la tendencia del índice de referencia, desactivando la estrategia en condiciones adversas.
Direcciones de optimización
-
Probar diferentes combinaciones de periodos para las EMA, encontrando las longitudes más adecuadas para cada activo.
-
Probar el uso de la media móvil del ATR o un factor de reducción para optimizar la distancia del stop loss.
-
Incorporar la lógica de evitar operar durante los periodos de cierre nocturno para mitigar el riesgo de gaps.
-
Añadir un filtro basado en la tendencia del mercado general, con una condición de activación/desactivación cuando el panorama sea desfavorable.
-
Realizar pruebas retrospectivas con datos históricos de varios años para seleccionar los parámetros que ofrezcan la mayor estabilidad en backtesting.
Conclusión
La estrategia optimizada de cruce de medias móviles exponenciales (EMAC) combina la identificación de tendencias, el filtrado de múltiples medias y el stop loss/take profit dinámico, con el objetivo de seguir las tendencias de mediano a largo plazo. En comparación con la versión original, se han optimizado los parámetros, lo que podría ofrecer un mejor rendimiento en tiempo real. Sin embargo, la estrategia aún necesita mejoras adicionales, incorporando más lógica para afrontar diversas condiciones de mercado, reducir los riesgos de trading en vivo y aumentar su estabilidad y rentabilidad.
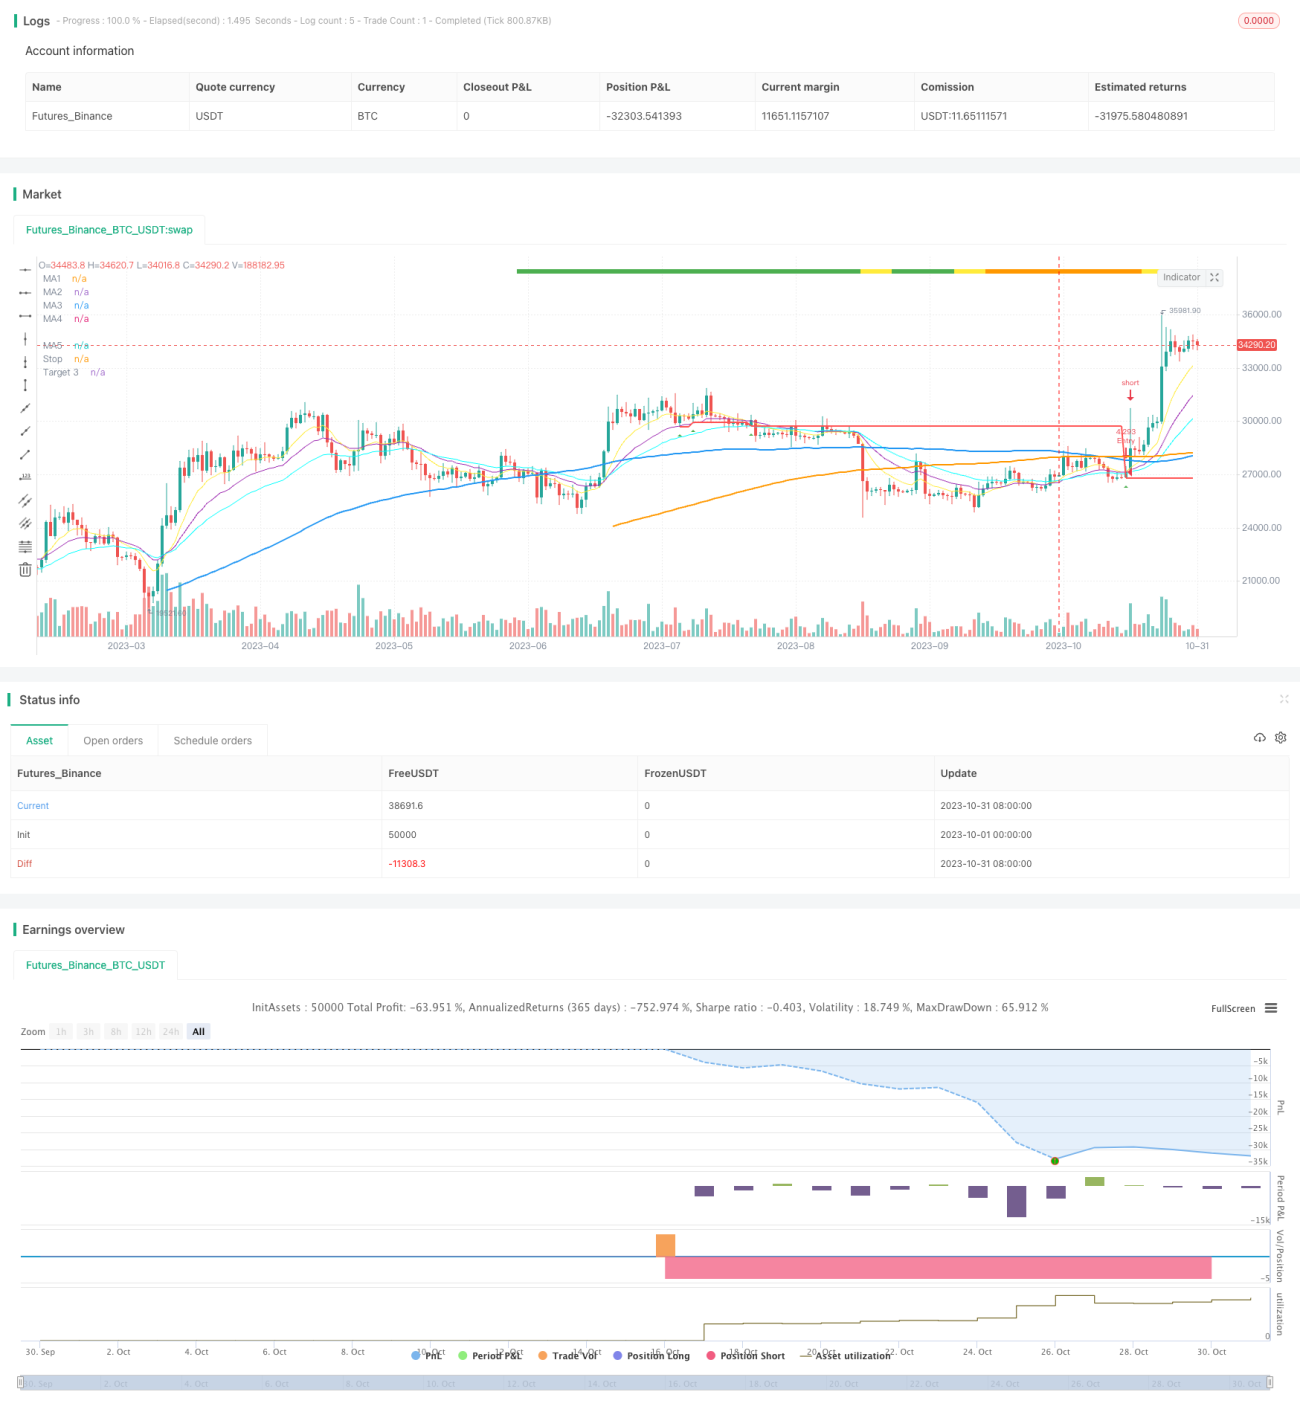
/*backtest
start: 2023-10-01 00:00:00
end: 2023-10-31 23:59:59
period: 1d
basePeriod: 1h
exchanges: [{"eid":"Futures_Binance","currency":"BTC_USDT"}]
*/

//@version=4
//Author = Dustin Drummond https://www.tradingview.com/u/Dustin_D_RLT/
//Strategy based in part on original 10ema Basic Swing Trade Strategy by Matt Delong: https://www.tradingview.com/u/MattDeLong/
//Link to original 10ema Basic Swing Trade Strategy: https://www.tradingview.com/script/8yhGnGCM-10ema-Basic-Swing-Trade-Strategy/- 1