Estrategia de seguimiento de tendencia de 5 minutos basada en cruces rápidos y lentos de EMA

Descripción general
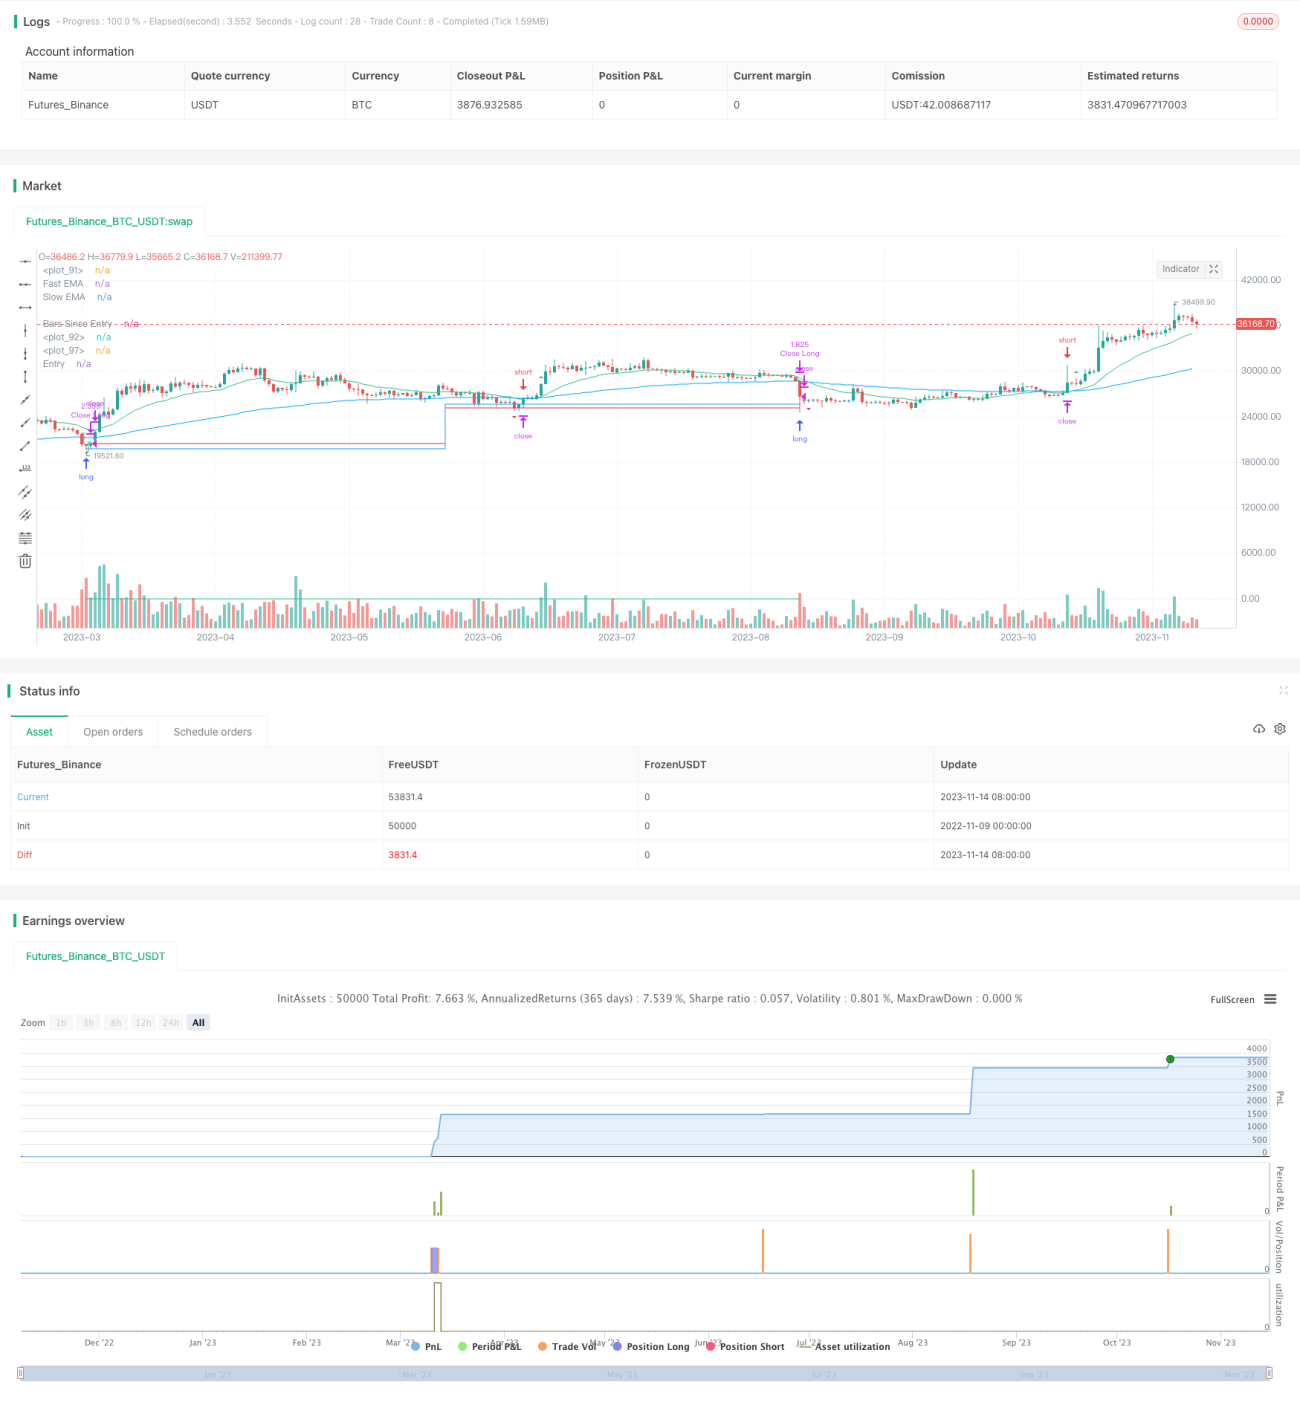
La estrategia es un sistema de cruce rápido de EMA basado en un marco de tiempo de 5 minutos, combinado con un pedido de precio límite y un seguimiento automático de la captura de pérdidas. La estrategia es adecuada para el comercio de tendencias de línea corta central, para determinar la dirección de la tendencia general a través de un filtro de EMA, y luego combinar el cruce rápido de EMA para ubicar un momento de entrada específico.
Principio de estrategia
- Usar EMA rápido y EMA lento, hacer más cuando se usa EMA rápido en EMA rápido, y hacer espacio cuando se usa EMA lento
- Utiliza el filtro macro de EMA para hacer más solo cuando el precio está por encima de EMA y para hacer hueco por debajo de EMA para evitar falsos breaks
- Utilice un listado de precios limitado para asegurar que los precios alcancen la posición esperada y luego ingrese.
- El uso de seguimiento dinámico para detener pérdidas, bloquear ganancias, detener pérdidas y salir después de la entrada
En concreto:
- El EMA rápido se calcula de acuerdo con la longitud del EMA rápido y el EMA lento, respectivamente
- Si se activa el filtro EMA, solo se puede hacer más si el precio es superior al EMA y se puede hacer menos si el precio es inferior al EMA
- Hacer más cuando el EMA rápido atraviesa el EMA lento; hacer espacio cuando el EMA rápido atraviesa el EMA lento
- Limite inferior para entradas múltiples y límite superior para entradas en blanco
- Inicia el seguimiento de los paros después de la entrada, realiza paros y paradas de seguimiento según los precios máximos de funcionamiento
Esto es lo que se llama la lógica básica de la estrategia.
Ventajas estratégicas
- Utiliza EMA para determinar la dirección de la tendencia general y evitar el comercio en contra
- El EMA, junto con la lista de precios límite, puede prevenir el seguimiento de las altas y bajas
- El seguimiento dinámico de la pérdida de capital para asegurar el beneficio
- El riesgo está controlado y cada stop loss está fijado en alrededor del 2%
- El retiro es menor y la tendencia es mejor capturada.
- Las estrategias son sencillas, claras, fáciles de entender y optimizar
Riesgo estratégico
- Hay cierto riesgo de que se produzcan falsas rupturas de tendencias, que podrían ser bloqueadas.
- La configuración inadecuada de los EMAs puede conducir a una tendencia perdida
- La amplitud de frenado está demasiado grande y puede detenerse fuera del rango de fluctuación normal
- El seguimiento de los daños es demasiado radical y podría terminar antes de tiempo
- La configuración de las proporciones de stop loss y stop loss no es razonable y puede perderse un escenario más amplio
Respuesta:
- Optimización de los parámetros de EMA para encontrar la mejor longitud de ciclo
- Disminuir el margen de pérdidas de forma adecuada para evitar que se detengan con demasiada frecuencia
- Configurar con prudencia el punto de inicio y la amplitud de seguimiento de la pérdida
- Prueba diferentes proporciones de stop loss para encontrar el parámetro óptimo
Dirección de optimización de la estrategia
- Optimización de los parámetros del ciclo EMA para encontrar la mejor combinación de parámetros
- Prueba con diferentes tipos de EMA, como las medias móviles ponderadas
- Prueba otros indicadores, como el MACD, para ver si puedes mejorar
- Intentar el filtro EMA en un marco de tiempo más avanzado
- Optimización de la franja de precios de entrada
- Optimización de puntos y proporciones en el stop loss
- Intentar un método más complejo de seguimiento de pérdidas
- La inclusión de indicadores de tendencia para determinar la fortaleza de la tendencia
- Considerar la adición de más filtros para evitar más brechas falsas
Resumir
La estrategia en general es una estrategia muy adecuada para el comercio de tendencias de línea corta y media, su tiempo de entrada rápido y lento, el precio límite para evitar el seguimiento de la caída y la caída, el seguimiento dinámico del stop loss y el proceso de bloqueo de las ganancias son muy claros, razonables y fáciles de operar. Mediante la optimización de ciertos parámetros, se puede mejorar aún más la ganancia y la rentabilidad de la estrategia. Por supuesto, también se debe tener en cuenta la prevención de riesgos generales como el ciclo de EMA inadecuado, el stop loss demasiado frecuente.
- 1