
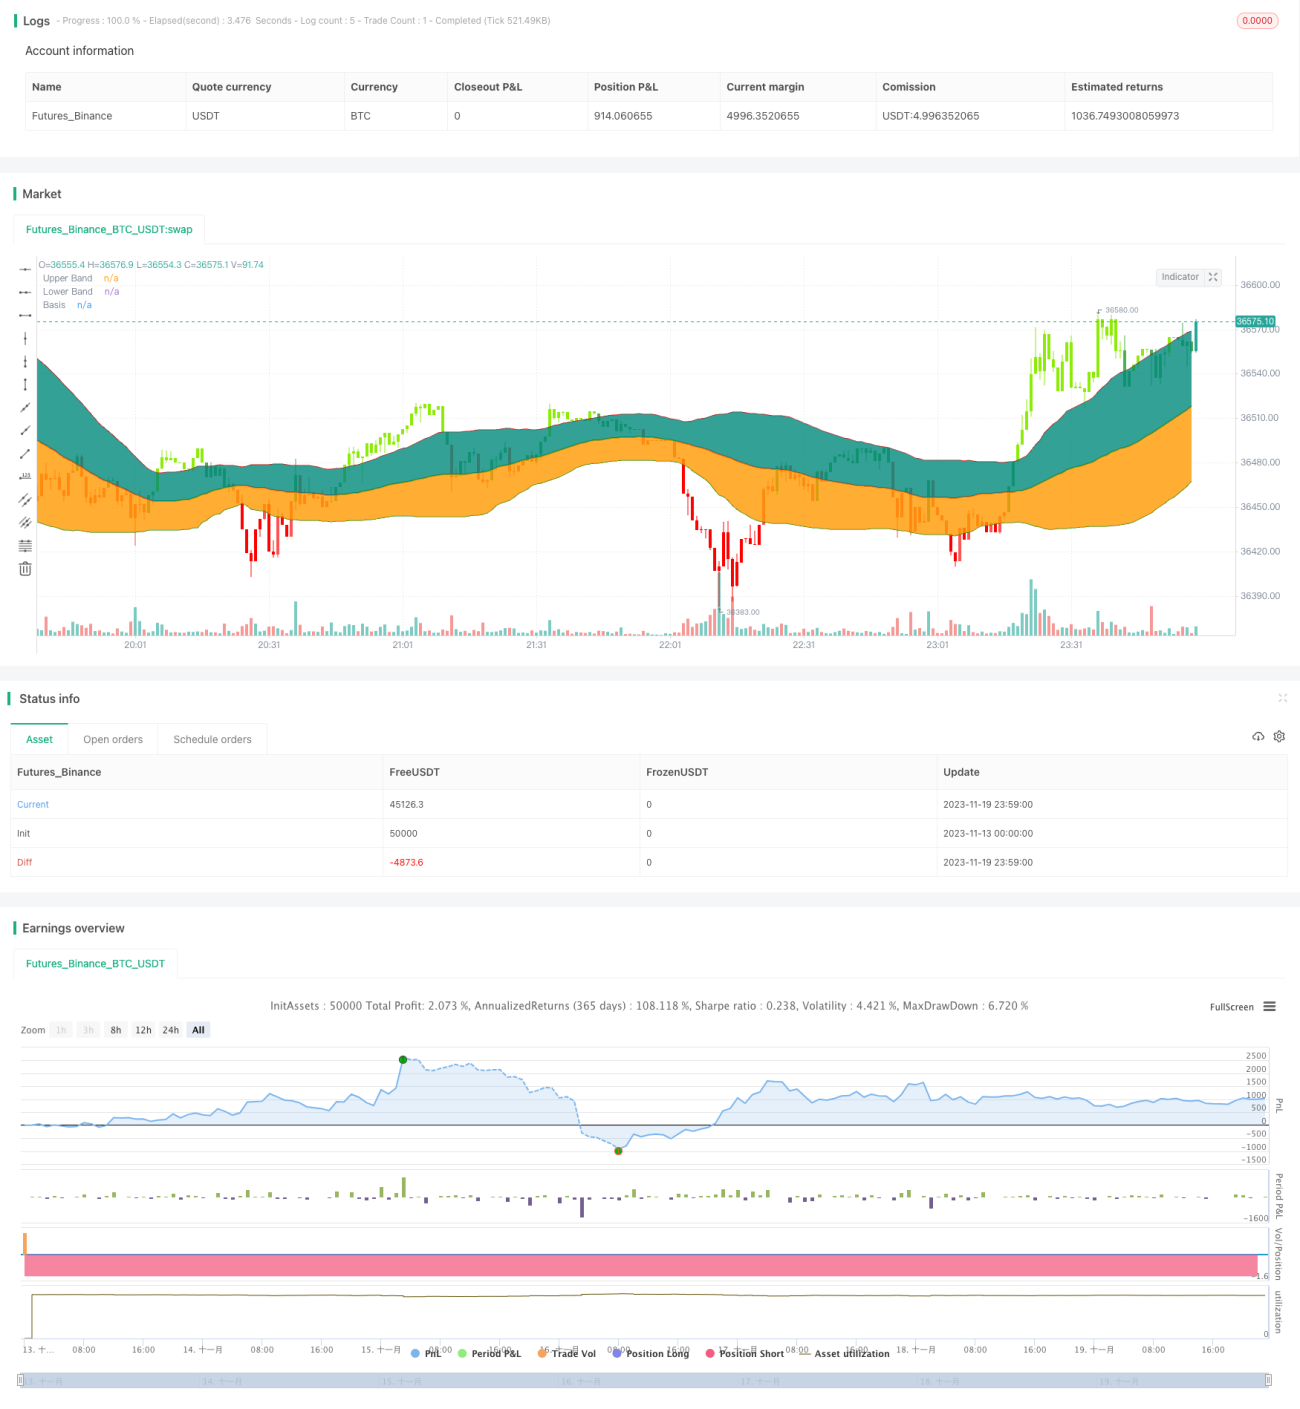
La estrategia se basa en el clásico indicador de bandas de Bollinger, que hace más cuando el cierre de precios se rompe en la vía ascendente, y hace menos cuando el cierre de precios se rompe en la vía descendente, y pertenece a la estrategia de seguimiento de tendencias.
Se puede reducir el riesgo mediante la configuración de stop loss, la consideración de las comisiones de transacción o la adición de filtros de indicadores.
La lógica general de la estrategia es clara, se ajusta el riesgo a través del ancho de banda de la diferencia estándar, se evita la brecha de cierre de la brecha falsa. Sin embargo, se debe tener en cuenta la prevención de pérdidas por choque, que se puede optimizar mediante el stop loss, el aumento de filtros, etc.
/*backtest
start: 2023-11-13 00:00:00
end: 2023-11-20 00:00:00
period: 1m
basePeriod: 1m
exchanges: [{"eid":"Futures_Binance","currency":"BTC_USDT"}]
*/
//@version=4
//┌───── •••• ─────┐//
// TradeChartist //
//└───── •••• ─────┘//
//Bollinger Bands is a classic indicator that uses a simple moving average of 20 periods along with upper and lower bands that are 2 standard deviations away from the basis line.
//These bands help visualize price volatility and trend based on where the price is in relation to the bands.
//This Bollinger Bands filter plots a long signal when price closes above the upper band and plots a short signal when price closes below the lower band.
//It doesn't take into account any other parameters such as Volume/RSI/fundamentals etc, so user must use discretion based on confirmations from another indicator or based on fundamentals.
//This filter's default is 55 SMA and 1 standard deviation, but can be changed based on asset type
//It is definitely worth reading the 22 rules of Bollinger Bands written by John Bollinger.
strategy(shorttitle="BB Breakout Strategy", title="Bollinger Bands Filter", overlay=true,
pyramiding=1, currency=currency.NONE ,
initial_capital = 10000, default_qty_type = strategy.percent_of_equity,
default_qty_value=100, calc_on_every_tick= true, process_orders_on_close=false)
src = input(close, title = "Source")
length = input(55, minval=1, title = "SMA length")// 20 for classis Bollinger Bands SMA line (basis)
mult = input(1., minval=0.236, maxval=2, title="Standard Deviation")//2 for Classic Bollinger Bands //Maxval = 2 as higher the deviation, higher the risk
basis = sma(src, length)
dev = mult * stdev(src,length)
CC = input(true, "Color Bars")
upper = basis + dev
lower = basis - dev
//Conditions for Long and Short - Extra filter condition can be used such as RSI or CCI etc.
short = src<lower// and rsi(close,14)<40
long = src>upper// and rsi(close,14)>60
L1 = barssince(long)
S1 = barssince(short)
longSignal = L1<S1 and not (L1<S1)[1]
shortSignal = S1<L1 and not (S1<L1)[1]
//Plots and Fills
////Long/Short shapes with text
// plotshape(S1<L1 and not (S1<L1)[1]?close:na, text = "sᴇʟʟ", textcolor=#ff0100, color=#ff0100, style=shape.triangledown, size=size.small, location=location.abovebar, transp=0, title = "SELL", editable = true)
// plotshape(L1<S1 and not (L1<S1)[1]?close:na, text = "ʙᴜʏ", textcolor = #008000, color=#008000, style=shape.triangleup, size=size.small, location=location.belowbar, transp=0, title = "BUY", editable = true)
// plotshape(shortSignal?close:na, color=#ff0100, style=shape.triangledown, size=size.small, location=location.abovebar, transp=0, title = "Short Signal", editable = true)
// plotshape(longSignal?close:na, color=#008000, style=shape.triangleup, size=size.small, location=location.belowbar, transp=0, title = "Long Signal", editable = true)
p1 = plot(upper, color=#ff0000, display=display.all, transp=75, title = "Upper Band")
p2 = plot(lower, color=#008000, display=display.all, transp=75, title = "Lower Band")
p = plot(basis, color=L1<S1?#008000:S1<L1?#ff0000:na, linewidth=2, editable=false, title="Basis")
fill(p,p1, color=color.teal, transp=85, title = "Top Fill") //fill for basis-upper
fill(p,p2, color=color.orange, transp=85, title = "Bottom Fill")//fill for basis-lower
//Barcolor
bcol = src>upper?color.new(#8ceb07,0):
src<lower?color.new(#ff0000,0):
src>basis?color.green:
src<basis?color.red:na
barcolor(CC?bcol:na, editable=false, title = "Color Bars")
// //Alerts ---- // Use 'Once per bar close'
// alertcondition(condition=longSignal, title="Long - BB Filter", message='BB Filter Long @ {{close}}') // Use 'Once per bar close'
// alertcondition(condition=shortSignal, title="Short - BB Filter", message='BB Filter Short @ {{close}}') // Use 'Once per bar close'
Notestart1 = input(true, "╔═══ Time Range to BackTest ═══╗")
// === INPUT BACKTEST RANGE ===
FromMonth = input(defval=1, title="From Month", minval=1, maxval=12)
FromDay = input(defval=1, title="From Day", minval=1, maxval=31)
FromYear = input(defval=2018, title="From Year", minval=2015)
ToMonth = input(defval=1, title="To Month", minval=1, maxval=12)
ToDay = input(defval=1, title="To Day", minval=1, maxval=31)
ToYear = input(defval=9999, title="To Year", minval=2010)
// === FUNCTION EXAMPLE ===
start = timestamp(FromYear, FromMonth, FromDay, 00, 00) // backtest start window
finish = timestamp(ToYear, ToMonth, ToDay, 23, 59) // backtest finish window
window() => // create function "within window of time"
time >= start and time <= finish ? true : false
if(window())
strategy.entry("Long", long=true, when = longSignal)
// strategy.close("Long", when = (short and S3==0), comment = "Close Long")
if(window())
strategy.entry("Short", long=false, when = shortSignal)
// strategy.close("Short", when = (long and L3==0), comment = "Close Short")