
La estrategia es una estrategia de comercio cuantitativa que utiliza el RSI y el indicador T3 para determinar la tendencia, en combinación con el indicador ATR para establecer una línea de parada y lograr que PMax se adapte a la ruptura. Su idea principal es optimizar el juicio de tendencia y la configuración de parada para aumentar la rentabilidad al mismo tiempo que controla el riesgo.
Calcular el RSI y el T3 para determinar la tendencia
Establecimiento de la línea de stop-loss adaptativa PMax según el indicador ATR
La brecha de compra y la salida a pérdida
La estrategia tiene las siguientes ventajas:
El principal riesgo de esta estrategia es:
Cuando se produce una reversión de precios en el corto plazo, puede ocasionar que el stop loss sea activado para generar una pérdida. Se puede relajar la línea de stop loss adecuadamente para reducir el efecto de la reversión.
Los indicadores RSI y T3 no son 100% confiables para determinar la tendencia, y los errores en el juicio también pueden causar pérdidas. Se pueden ajustar los parámetros adecuadamente o agregar otros indicadores para optimizar.
La estrategia puede ser optimizada en los siguientes aspectos:
Esta estrategia integra las ventajas de usar los tres indicadores RSI, T3 y ATR, logrando una combinación orgánica de juicio de tendencias y control de riesgos. En comparación con un solo indicador, la combinación tiene una alta precisión de juicio y un control de retroceso, una estrategia de seguimiento de tendencias confiable.
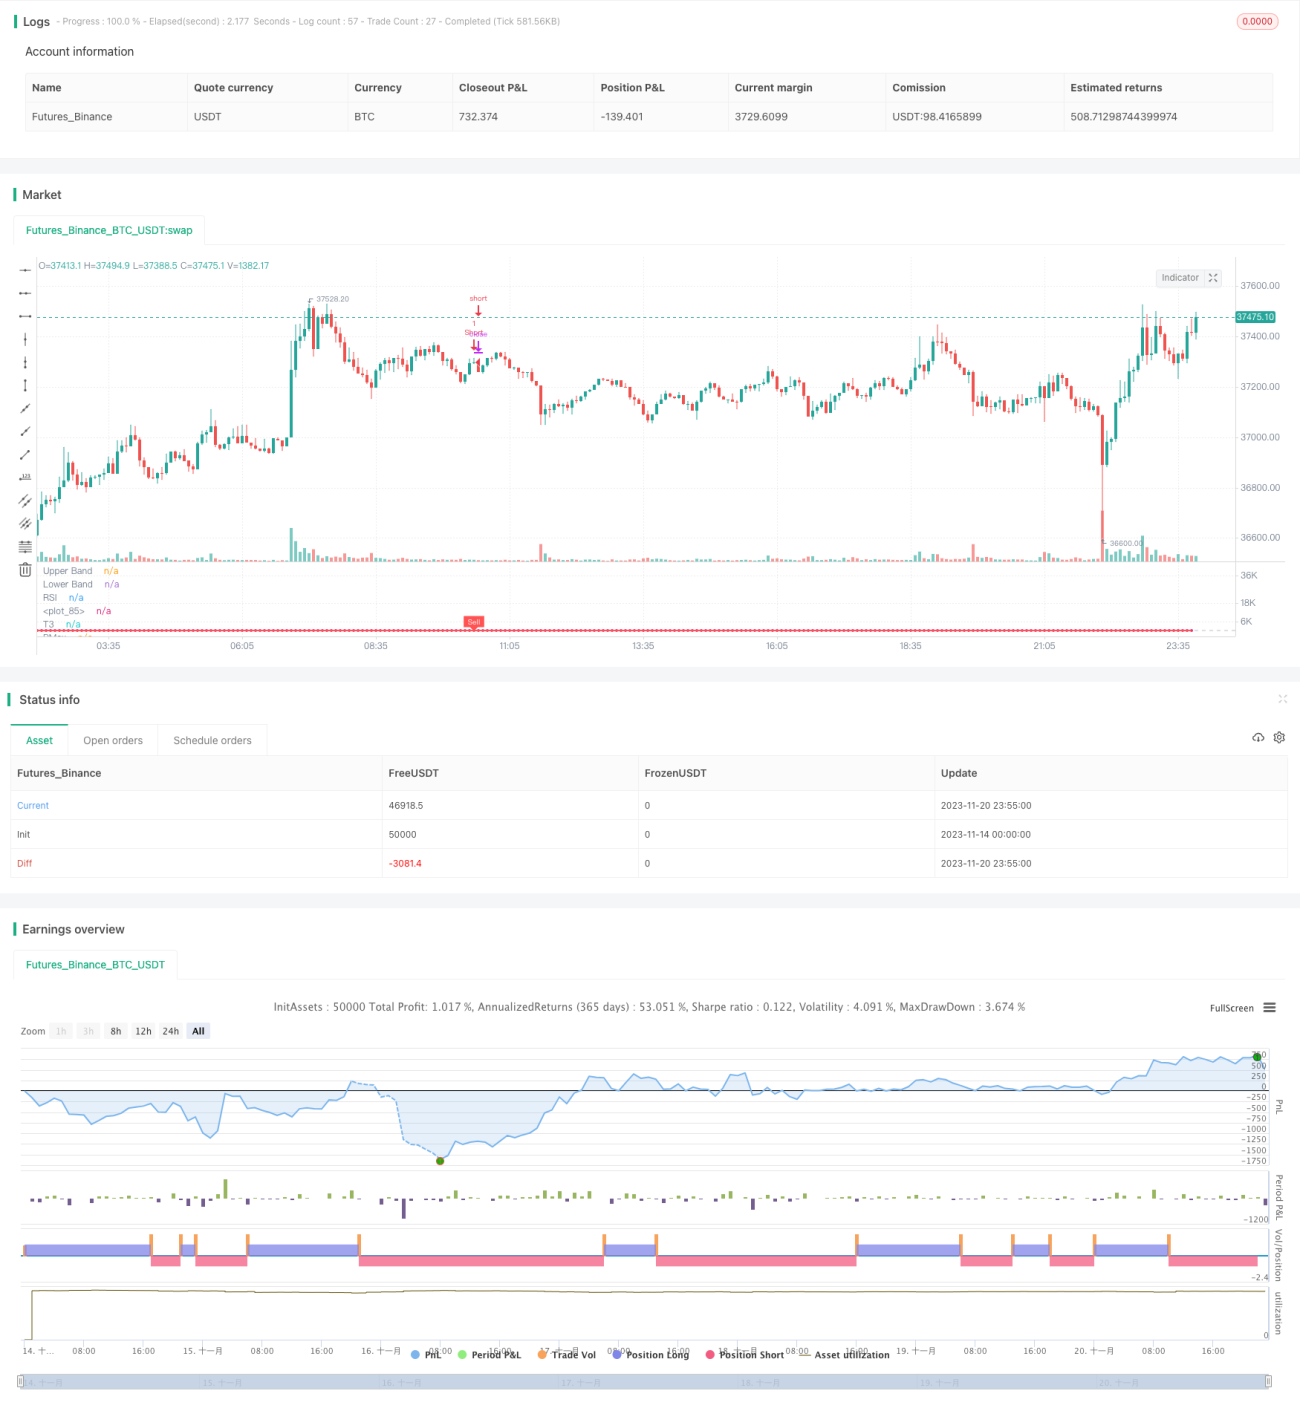
/*backtest
start: 2023-11-14 00:00:00
end: 2023-11-21 00:00:00
period: 5m
basePeriod: 1m
exchanges: [{"eid":"Futures_Binance","currency":"BTC_USDT"}]
*/
//@version=4
// This source code is subject to the terms of the Mozilla Public License 2.0 at https://mozilla.org/MPL/2.0/
// © KivancOzbilgic
//developer: @KivancOzbilgic
//author: @KivancOzbilgic
strategy("PMax on Rsi w T3 Strategy","PmR3St.", overlay=false, precision=2)
src = input(hl2, title="Source")
Multiplier = input(title="ATR Multiplier", type=input.float, step=0.1, defval=3)
length =input(8, "Tillson T3 Length", minval=1)
T3a1 = input(0.7, "TILLSON T3 Volume Factor", step=0.1)
Periods = input(10,title="ATR Length", type=input.integer)
rsilength = input(14, minval=1, title="RSI Length")
showrsi = input(title="Show RSI?", type=input.bool, defval=true)
showsupport = input(title="Show Moving Average?", type=input.bool, defval=true)
showsignalsk = input(title="Show Crossing Signals?", type=input.bool, defval=true)
highlighting = input(title="Highlighter On/Off ?", type=input.bool, defval=true)
i = close>=close[1] ? close-close[1] : 0
i2 = close<close[1] ? close[1]-close : 0
Wwma_Func(src,rsilength)=>
wwalpha = 1/ rsilength
WWMA = 0.0
WWMA := wwalpha*src + (1-wwalpha)*nz(WWMA[1])
WWMA=Wwma_Func(src,rsilength)
AvUp = Wwma_Func(i,rsilength)
AvDown = Wwma_Func(i2,rsilength)
AvgUp = sma(i,rsilength)
AvgDown =sma(i2,rsilength)
k1 = high>close[1] ? high-close[1] : 0
k2 = high<close[1] ? close[1]-high : 0
k3 = low>close[1] ? low-close[1] : 0
k4 = low<close[1] ? close[1]-low : 0
AvgUpH=(AvgUp*(rsilength-1)+ k1)/rsilength
AvgDownH=(AvgDown*(rsilength-1)+ k2)/rsilength
AvgUpL=(AvgUp*(rsilength-1)+ k3)/rsilength
AvgDownL=(AvgDown*(rsilength-1)+ k4)/rsilength
rs = AvUp/AvDown
rsi= rs==-1 ? 0 : (100-(100/(1+rs)))
rsh=AvgUpH/AvgDownH
rsih= rsh==-1 ? 0 : (100-(100/(1+rsh)))
rsl=AvgUpL/AvgDownL
rsil= rsl==-1 ? 0 : (100-(100/(1+rsl)))
TR=max(rsih-rsil,abs(rsih-rsi[1]),abs(rsil-rsi[1]))
atr=sma(TR,Periods)
plot(showrsi ? rsi : na, "RSI", color=#8E1599)
band1 = hline(70, "Upper Band", color=#C0C0C0)
band0 = hline(30, "Lower Band", color=#C0C0C0)
fill(band1, band0, color=#9915FF, transp=90, title="Background")
T3e1=ema(rsi, length)
T3e2=ema(T3e1,length)
T3e3=ema(T3e2,length)
T3e4=ema(T3e3,length)
T3e5=ema(T3e4,length)
T3e6=ema(T3e5,length)
T3c1=-T3a1*T3a1*T3a1
T3c2=3*T3a1*T3a1+3*T3a1*T3a1*T3a1
T3c3=-6*T3a1*T3a1-3*T3a1-3*T3a1*T3a1*T3a1
T3c4=1+3*T3a1+T3a1*T3a1*T3a1+3*T3a1*T3a1
T3=T3c1*T3e6+T3c2*T3e5+T3c3*T3e4+T3c4*T3e3
MAvg=T3
Pmax_Func(rsi,length)=>
longStop = MAvg - Multiplier*atr
longStopPrev = nz(longStop[1], longStop)
longStop := MAvg > longStopPrev ? max(longStop, longStopPrev) : longStop
shortStop = MAvg + Multiplier*atr
shortStopPrev = nz(shortStop[1], shortStop)
shortStop := MAvg < shortStopPrev ? min(shortStop, shortStopPrev) : shortStop
dir = 1
dir := nz(dir[1], dir)
dir := dir == -1 and MAvg > shortStopPrev ? 1 : dir == 1 and MAvg < longStopPrev ? -1 : dir
PMax = dir==1 ? longStop: shortStop
PMax=Pmax_Func(rsi,length)
plot(showsupport ? MAvg : na, color=color.black, linewidth=2, title="T3")
pALL=plot(PMax, color=color.red, linewidth=2, title="PMax", transp=0)
alertcondition(cross(MAvg, PMax), title="Cross Alert", message="PMax - Moving Avg Crossing!")
alertcondition(crossover(MAvg, PMax), title="Crossover Alarm", message="Moving Avg BUY SIGNAL!")
alertcondition(crossunder(MAvg, PMax), title="Crossunder Alarm", message="Moving Avg SELL SIGNAL!")
alertcondition(cross(src, PMax), title="Price Cross Alert", message="PMax - Price Crossing!")
alertcondition(crossover(src, PMax), title="Price Crossover Alarm", message="PRICE OVER PMax - BUY SIGNAL!")
alertcondition(crossunder(src, PMax), title="Price Crossunder Alarm", message="PRICE UNDER PMax - SELL SIGNAL!")
buySignalk = crossover(MAvg, PMax)
plotshape(buySignalk and showsignalsk ? PMax*0.995 : na, title="Buy", text="Buy", location=location.absolute, style=shape.labelup, size=size.tiny, color=color.green, textcolor=color.white, transp=0)
sellSignallk = crossunder(MAvg, PMax)
plotshape(sellSignallk and showsignalsk ? PMax*1.005 : na, title="Sell", text="Sell", location=location.absolute, style=shape.labeldown, size=size.tiny, color=color.red, textcolor=color.white, transp=0)
mPlot = plot(rsi, title="", style=plot.style_circles, linewidth=0,display=display.none)
longFillColor = highlighting ? (MAvg>PMax ? color.green : na) : na
shortFillColor = highlighting ? (MAvg<PMax ? color.red : na) : na
fill(mPlot, pALL, title="UpTrend Highligter", color=longFillColor)
fill(mPlot, pALL, title="DownTrend Highligter", color=shortFillColor)
dummy0 = input(true, title = "=Backtest Inputs=")
FromDay = input(defval = 1, title = "From Day", minval = 1, maxval = 31)
FromMonth = input(defval = 1, title = "From Month", minval = 1, maxval = 12)
FromYear = input(defval = 2005, title = "From Year", minval = 2005)
ToDay = input(defval = 1, title = "To Day", minval = 1, maxval = 31)
ToMonth = input(defval = 1, title = "To Month", minval = 1, maxval = 12)
ToYear = input(defval = 9999, title = "To Year", minval = 2006)
Start = timestamp(FromYear, FromMonth, FromDay, 00, 00)
Finish = timestamp(ToYear, ToMonth, ToDay, 23, 59)
Timerange() =>
time >= Start and time <= Finish ? true : false
if buySignalk
strategy.entry("Long", strategy.long,when=Timerange())
if sellSignallk
strategy.entry("Short", strategy.short,when=Timerange())