Estrategia de negociación con impulso del sistema de doble vía

[trans]
Descripción general
Esta estrategia utiliza MACD y Stoch RSI para combinar dos indicadores, para construir un sistema de comercio de dos vías, para permitir el seguimiento de la tendencia y el juicio de compra y venta. La estrategia construye el indicador a la vez en la línea diaria y en la línea de 4 horas, para permitir el juicio de varios marcos de tiempo, para reducir la probabilidad de error de juicio.
Principio de estrategia
La combinación de estrategias utiliza dos tipos diferentes de indicadores técnicos, el MACD y el RSI de Stoch, para configurar. El MACD es un indicador de desviación, que determina la velocidad de cambio de precios; el RSI de Stoch es un indicador de sobreventa y sobreventa, que determina la fuerza relativa de los precios.
La estrategia comienza construyendo los indicadores MACD y Stoch RSI en la línea diaria y la línea de 4 horas, respectivamente, para tomar decisiones de tendencia y sobrecompra y sobreventa. Cuando los indicadores de los dos períodos de tiempo emiten señales de compra/venta al mismo tiempo, realice la operación de compra/venta correspondiente.
Concretamente, la construcción del indicador MACD, la línea DIF y la línea DEA constituyen un forcado dorado para juzgar; la construcción del indicador Stoch RSI, la línea K y la línea D constituyen un forcado dorado para juzgar. Cuando los dos grupos de indicadores producen una señal de compra cuando se forcan al mismo tiempo y una señal de venta cuando se forcan al mismo tiempo.
De esta manera, la aplicación integral de indicadores de dos vías y el juicio de varios marcos temporales en la estrategia permite un juicio integral de la velocidad de cambio de los precios y la fuerza relativa, lo que ayuda a mejorar la precisión de las decisiones y obtener mejores resultados.
Análisis de las ventajas
Esta estrategia tiene las siguientes ventajas:
- Combinación de indicadores de doble vía para un juicio integral y una mayor precisión en la toma de decisiones
- El uso de múltiples marcos de tiempo reduce la probabilidad de error
- Utilizando el seguimiento de tendencias y el juicio de sobrecompra y sobreventa, se considera la velocidad de cambio de precios y la relativa debilidad
- Los parámetros del indicador pueden adaptarse a diferentes variedades y entornos del mercado
- La estructura del código es clara, fácil de entender y extender
Análisis de riesgos
La estrategia también tiene sus riesgos:
- El riesgo sistémico en el mercado es inevitable
- La configuración incorrecta de los parámetros del indicador puede provocar una operación frecuente o una oportunidad perdida
- La probabilidad de que los indicadores de dos vías emitan una señal errónea al mismo tiempo existe, pero es menor que la de un solo indicador
- No puede hacer frente a los cambios bruscos en el mercado, como el gran evento de Black Swan.
Respuesta:
- Optimización de parámetros, ajuste de las condiciones de compra y venta, reducción de errores de juicio
- Combinación de más indicadores para una base de juicio más amplia
- Incrementar las estrategias de deterioro y controlar el riesgo de pérdidas únicas
Dirección de optimización
La estrategia también puede ser optimizada en los siguientes aspectos:
- Aumentar el número de indicadores para combinarlos y construir una estrategia multi-indicador
- Aumentar el algoritmo de aprendizaje automático para optimizar los parámetros dinámicos
- Más información sobre la situación del mercado junto con indicadores de sentimiento y noticias
- Aumentar las estrategias de stop loss y de suspensión de pérdidas y optimizar la gestión de fondos
- Expandir las variedades de comercio y buscar mejores oportunidades
Resumir
Esta estrategia utiliza una combinación de indicadores de dos vías y un juicio de varios marcos temporales para juzgar la velocidad de cambio de precios y la fortaleza relativa de manera integral. Puede obtener de manera efectiva las tendencias del mercado y mejorar los errores de juicio de un solo indicador. También tiene la ventaja de ajustar los parámetros de manera flexible, fácil de entender y ampliar.
||
Overview
This strategy combines the MACD and Stoch RSI indicators to build a dual-rail trading system for trend tracking and oversold/overbought judgment. The strategy also builds indicators on the daily and 4-hour timeframes to make multi-timeframe judgments to reduce misjudgment probability.
Strategy Principle
The strategy combines the MACD and Stoch RSI indicators, which are different types of technical indicators, for configuration. MACD is a momentum indicator that judges price change velocity; Stoch RSI is an overbought/oversold indicator that judges relative price strength.
The strategy first constructs the MACD and Stoch RSI indicators on the daily and 4-hour timeframes respectively for trend and overbought/oversold judgments. When signals are triggered on both timeframes, corresponding buy/sell operations are performed.
Specifically, the MACD indicator is constructed with the DIF and DEA lines forming golden/dead crosses for judgment; the Stoch RSI indicator is constructed with the K and D lines forming golden/dead crosses for judgment. When both indicator pairs have golden crosses, buy signals are generated; when both have dead crosses, sell signals are generated.
Thus, by comprehensively applying the dual-indicator system and multi-timeframe judgments, the strategy judges price velocity and relative strength thoroughly, which helps improve decision accuracy and gain better returns.
Advantage Analysis
This strategy has the following advantages:
- Combining dual-indicator system for comprehensive judgment and higher decision accuracy
- Applying multi-timeframe to reduce misjudgment probability
- Adopting trend tracking and overbought/oversold judgment for consideration of both price velocity and relative strength
- Flexible indicator parameters adjustable for different products and market environments
- Clean code structure easy to understand and expand
Risk Analysis
There are also some risks with this strategy:
- There exist systemic market risks that cannot be fully avoided
- Inappropriate indicator parameter settings may lead to overtrading or missing opportunities
- Dual indicators may still give concurrent wrong signals, but less likely than single ones
- Unable to cope with drastic market changes like black swan events
Countermeasures:
- Optimize parameters and adjust trading conditions to reduce misjudgments
- Incorporate more indicators for combined judgments
- Add stop loss mechanisms to control single loss risk
Optimization Directions
This strategy can also be improved in the following aspects:
- Incorporate more indicators for multi-indicator strategies
- Add machine learning algorithms for dynamic parameter optimization
- Combine sentiment indicators, news etc. for more comprehensive market condition judgments
- Add stop loss, take profit strategies to optimize money management
- Expand to more trading products to discover better opportunities
Conclusion
By combined application of the dual-indicator system and multi-timeframe judgments, this strategy judges price velocity and relative strength thoroughly, which can effectively capture market trends and improve deficiencies of single indicators. It also has advantages like flexible parameter tuning, easy understanding and expansion. Further expansions by multi-indicator combination, dynamic parameter optimization, sentiment indicator incorporation etc. can help boost strategy performance.
[trans]
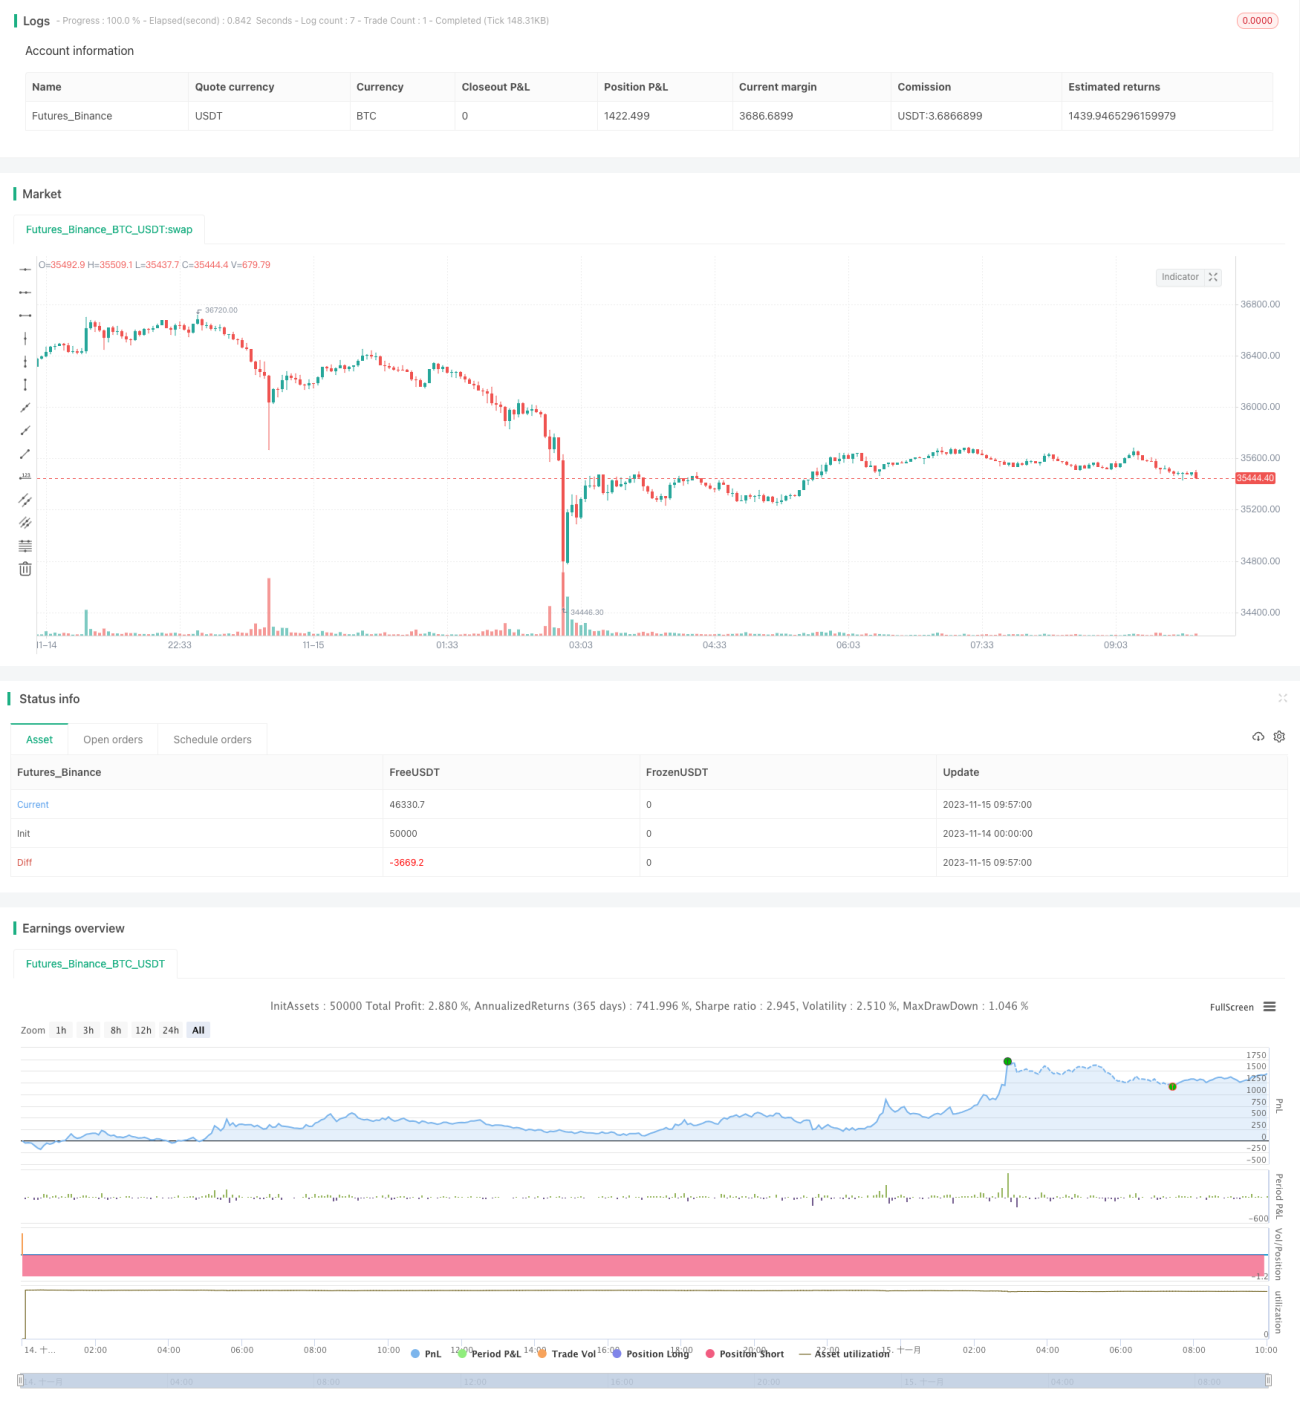
/*backtest
start: 2023-11-14 00:00:00
end: 2023-11-15 10:00:00
period: 3m
basePeriod: 1m
exchanges: [{"eid":"Futures_Binance","currency":"BTC_USDT"}]
*/

//@version=2
strategy(title='[RS]Khizon (UWTI) Strategy V0', shorttitle='K', overlay=false, pyramiding=0, initial_capital=100000, currency=currency.USD)
//  ||  Inputs:
macd_src = input(title='MACD Source:', defval=close)- 1