Estrategia del indicador técnico de bandas de Bollinger basada en la descomposición de series temporales y ponderación del volumen

Descripción general
La estrategia combina la descomposición de la secuencia temporal, el precio promedio ponderado por volumen de transacción, las bandas de Brin y el delta (OBV-PVT) de 4 indicadores técnicos para lograr un juicio multidimensional de la tendencia de los precios, las sobrecompras y las sobreventa.
Principio de estrategia
- El uso de la descomposición de la secuencia temporal elimina el ruido y la periodicidad en los precios, lo que permite un juicio más preciso de las tendencias.
- Basándose en esta línea de tendencia, se calcula el nuevo precio ponderado por volumen de transacciones.
- Calcular el indicador de la banda de Bryn de la anchura porcentual de cierre BB%B para determinar el exceso de compra y venta;
- Calcular el porcentaje de ancho de banda de Bryn del delta de variación de OBV-PVT como criterio para el desviación del precio;
- La señal de negociación se genera a partir de la intersección múltiple de los indicadores de precio y medida y la reversión de los indicadores de la banda de Bryn.
Análisis de las ventajas
- La estrategia es robusta, combinada con una variedad de criterios de precios, volumen de ventas y características estadísticas.
- La combinación de BB%B y Delta (OBV-PVT) puede ayudar a evaluar mejor las tendencias de sobrecompra y sobreventa en el corto plazo.
- La señal de cruce de precios filtró parte del ruido en los puntos de intercambio.
Análisis de riesgos
- La configuración de los parámetros es demasiado compleja y difícil de ajustar;
- Las perturbaciones de corta duración pueden aumentar los daños.
- La desviación de precio no puede filtrar completamente las señales engañosas.
Se puede optimizar la estrategia mediante el ajuste del ciclo de la línea media, la amplitud de la banda de Brin y la relación de riesgo-pérdidas, reduciendo la frecuencia de las operaciones y aumentando la relación de pérdidas por transacción única.
Resumir
La estrategia utiliza una serie de herramientas de análisis, como la descomposición de la secuencia temporal, el indicador de la banda de Brin y el indicador OBV, para identificar los efectos secundarios a corto plazo y capturar las principales tendencias del mercado a través de una combinación orgánica de relaciones cuantitativas, características estadísticas y juicio de tendencias. Al mismo tiempo, existe un cierto riesgo que requiere un ajuste de parámetros para alcanzar el estado óptimo.
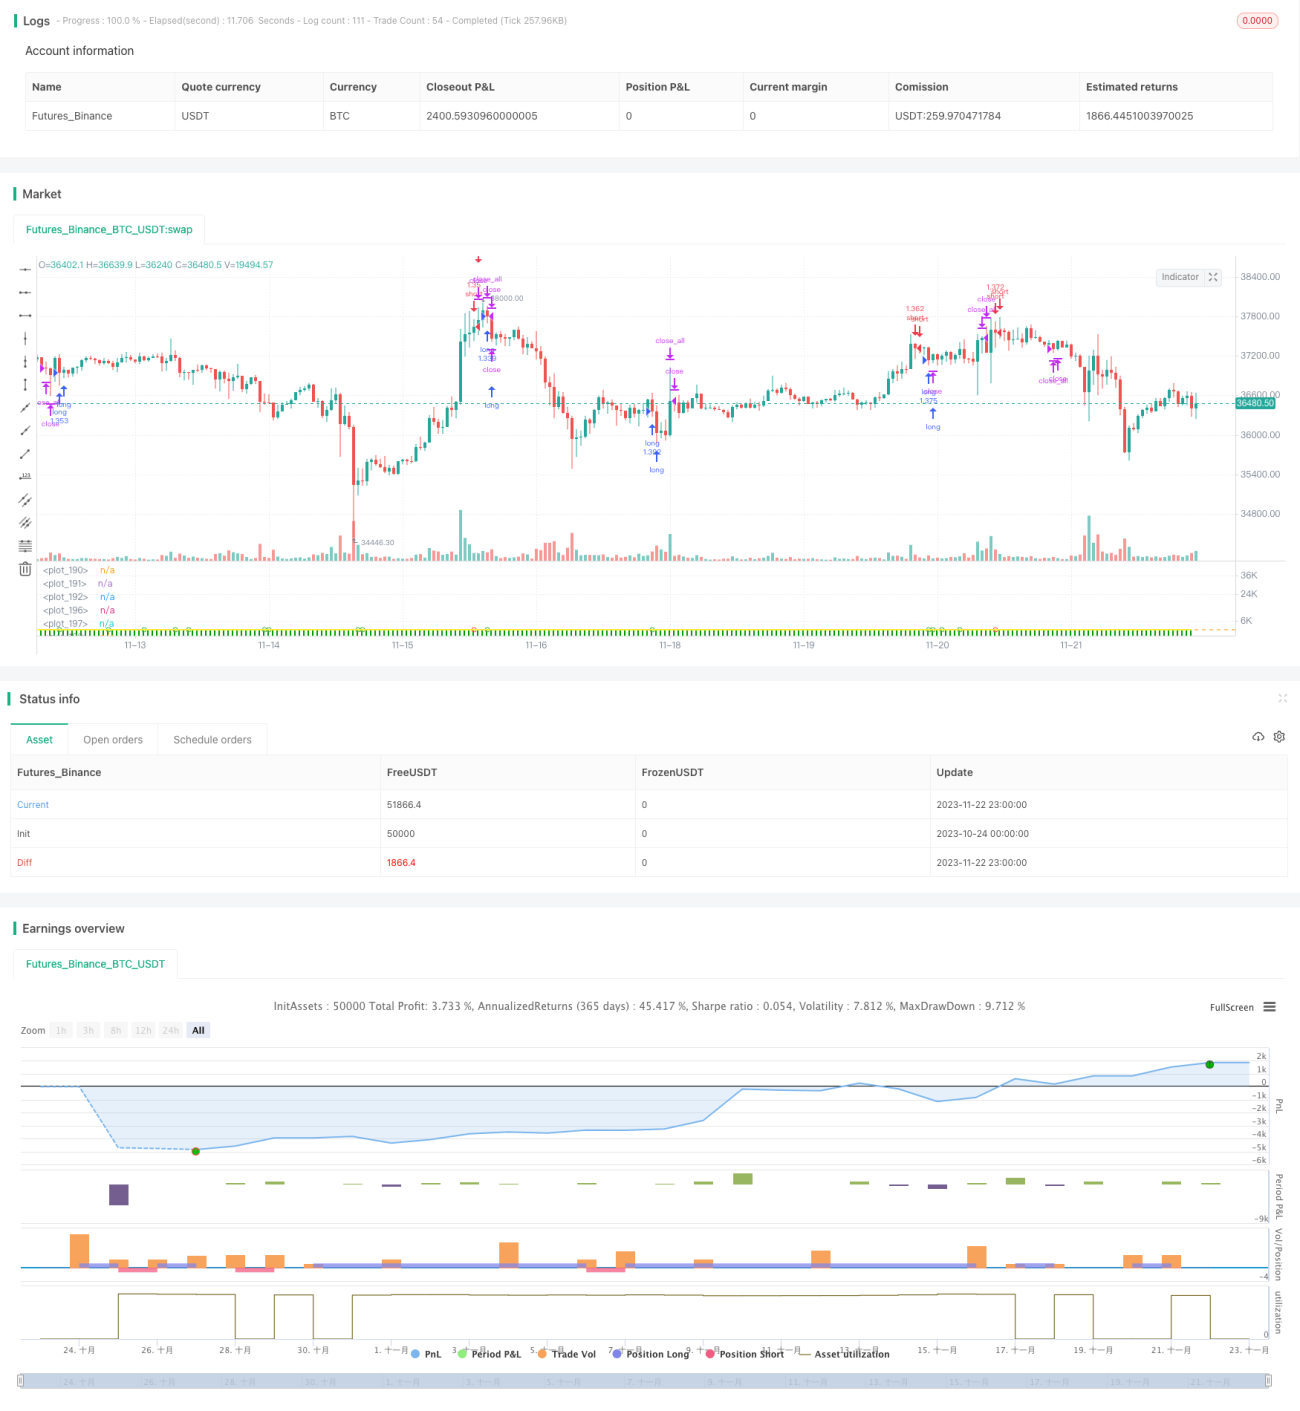
/*backtest
start: 2023-10-24 00:00:00
end: 2023-11-23 00:00:00
period: 1h
basePeriod: 15m
exchanges: [{"eid":"Futures_Binance","currency":"BTC_USDT"}]
*/

// This source code is subject to the terms of the Mozilla Public License 2.0 at https://mozilla.org/MPL/2.0/
//// This source code is subject to the terms of the Mozilla Public License 2.0 at https://mozilla.org/MPL/2.0/
// © oakwhiz and tathal
- 1