Estrategia de trading cuantitativo de los tres mosqueteros con media móvil
Descripción: Esta estrategia es una estrategia típica de análisis técnico que utiliza varios indicadores de línea media comúnmente utilizados, como EMA, así como indicadores auxiliares como RSI, MACD y PSR, para formar reglas de entrada y parada de pérdidas a través de una combinación de diferentes configuraciones de línea media periódicas y señales de indicadores.
Principio de la estrategia: el núcleo de la estrategia es la media de 5, 9 y 21 días. Cuando la media de corto período está en la media de largo período, y la media de corto período está en la media de largo período. Además, en combinación con el indicador RSI para determinar el exceso de venta, el indicador MACD para determinar la tendencia, el indicador PSR para identificar la resistencia de soporte para el comercio de combinación.
El análisis de la estrategia:
- El indicador de la línea media es claro e intuitivo, lo que facilita la determinación de la dirección de la tendencia.
- El RSI es eficaz para identificar sobrecompras y sobreventas, el MACD para determinar tendencias largas y cortas, el PSR para encontrar precios clave, y el conjunto de indicadores complementarios.
- La variedad de reglas de entrada y la flexibilidad de configuración de los parámetros.
- Hay más combinaciones de indicadores y parámetros que se pueden optimizar y adaptar a la evolución del mercado.
Análisis de riesgos:
- Las operaciones de ciclo corto son difíciles de captar y corren el riesgo de perder la reversión.
- La configuración incorrecta de los parámetros puede causar demasiadas falsas señales o señales perdidas.
- Los indicadores puramente técnicos son susceptibles de ser usados por las agencias de arbitraje para generar pérdidas.
- La mayoría de las personas que viven en el área son de origen indígena, pero la mayoría de las personas que viven en el área son indígenas.
Cómo hacer frente a esto:
- Aprovechar adecuadamente la tendencia de la línea larga para evitar operaciones de línea corta en contra.
- Optimización de la combinación de parámetros, configuración de stop loss y control de riesgos.
- Tenga en cuenta la posibilidad de retroceso en el nivel alto y rebote en el nivel bajo.
La dirección de la optimización:
- Ajuste los parámetros de la línea media para probar la combinación óptima.
- Añadir otros indicadores auxiliares para filtrar las señales.
- Aumentar la probabilidad de juicio de los indicadores de aprendizaje automático.
- La precisión de las señales aumentó con el cambio en el volumen de transacciones.
- Aumentar las estrategias de detener las pérdidas para evitar que las pérdidas se extiendan.
Conclusión: La estrategia integra una variedad de señales de indicadores auxiliares, aprovechando las ventajas de los indicadores de la línea media, para aprovechar las oportunidades de compra y venta de la línea corta. La optimización de los parámetros y la combinación de indicadores pueden mejorar continuamente la eficacia de la estrategia, pero se necesita un control moderado de la frecuencia y el riesgo de las operaciones para evitar que una sola pérdida afecte demasiado a la ganancia general.
||
Overview: This strategy is a typical technical analysis strategy that utilizes several common moving average indicators like EMA and auxiliary indicators like RSI, MACD, PSR to form entry and stop loss rules for finding low buy high sell opportunities.
Principle: The core of this strategy is the 5, 9, 21 day moving averages. When the short period MA crosses over the long period one, it signals an uptrend; when the short period MA crosses below the long period one, it signals a downtrend. In addition, RSI is used to determine overbought and oversold levels, MACD to judge the trend, PSR to identify support and resistance for combo trading. The background color shows market sentiment to assist trend judgment. The parameters are customizable for configuring entry rules.
Advantages:
- MA indicators give clear trend direction.
- RSI effectively spots overbought/oversold levels, MACD judges short-long trend, PSR finds key price levels. The indicators are complementary.
- Flexible entry rules and parameter settings.
- Many optimizable indicators and parameter combinations adaptable to varying market conditions.
Risks:
- Short-term operations may fail to capture major trend and miss reversals.
- Improper parameter configuration can lead to too many false signals or missing good signals.
- Pure technical indicators are susceptible to manipulation by arbitrageurs causing losses.
- Prone to being stopped out in high volatile markets.
Solutions:
- Capture mid-long term trend appropriately to avoid trading against major trend.
- Optimize parameters, use stop loss to control risks.
- Watch out the possibilities of pullback from highs and bounce from lows.
Optimization:
- Fine tune MA parameters for best combo.
- Add more indicators to filter signals.
- Increase machine learning metrics for probability estimate.
- Combine volume changes to enhance signal accuracy.
- Add stop loss to restrict loss expansion.
Summary: This strategy integrates multiple auxiliary signals, leverages the strength of MA indicators to identify short-term low buy high sell chances. Parameters and indicators combinations may be optimized continuously to improve strategy efficacy, but operation frequency and risks should be moderated to prevent oversized single trade loss from eroding overall profitability.
[/trans]
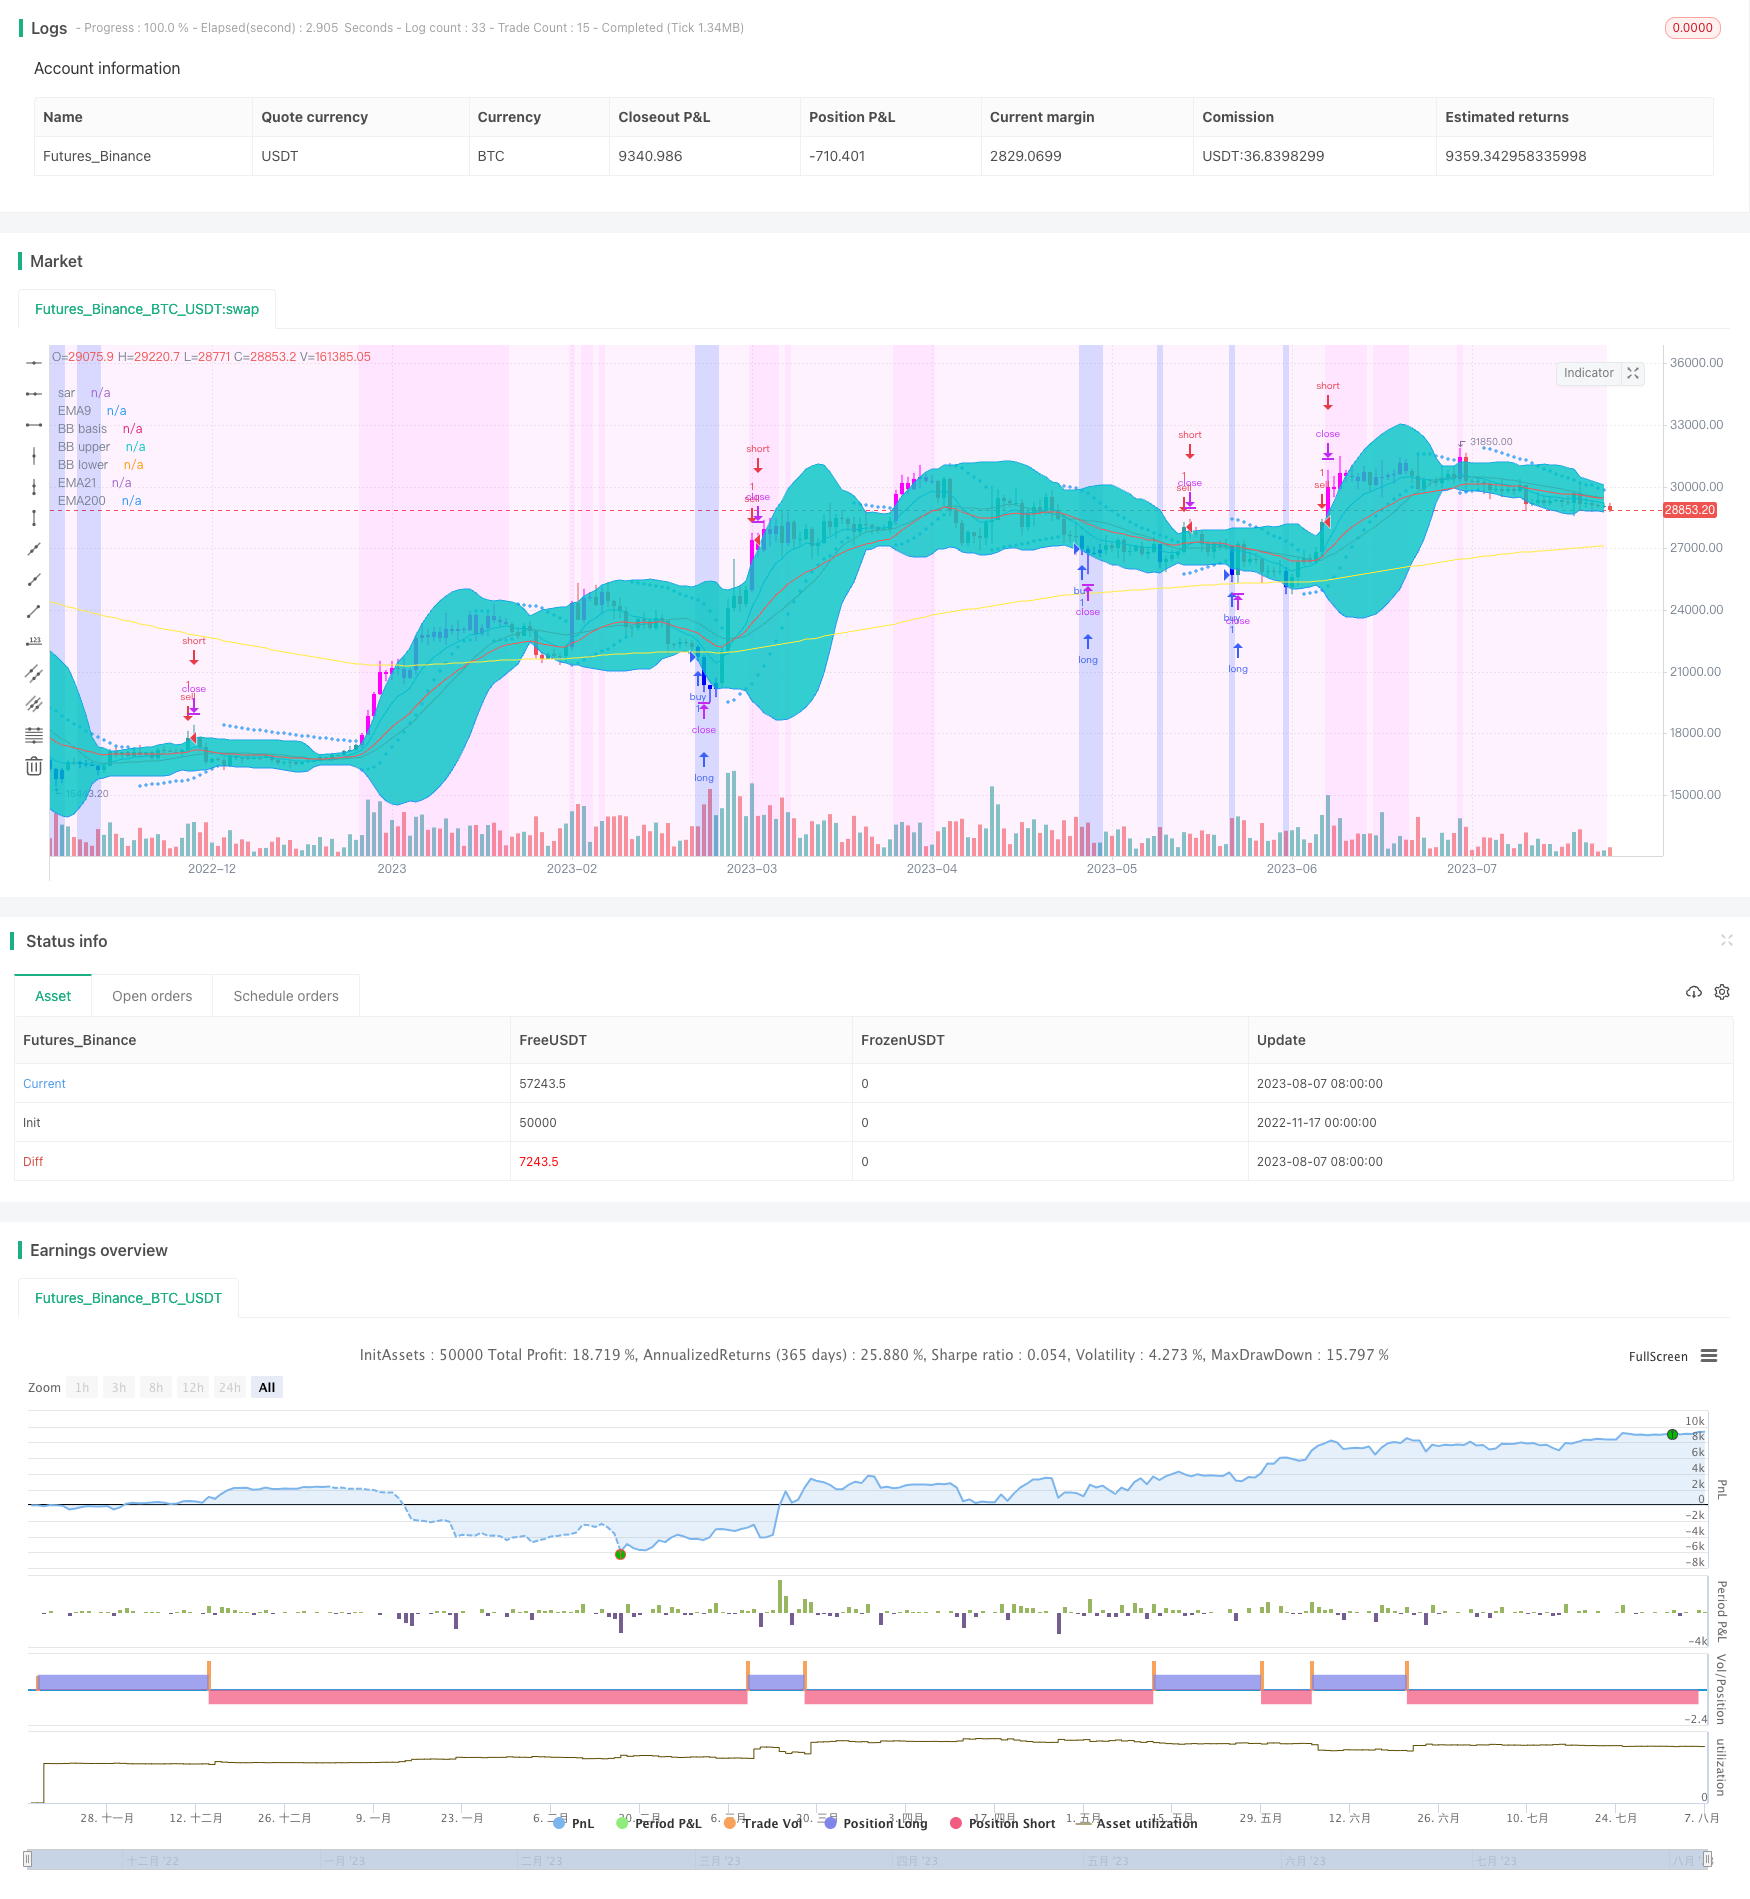
/*backtest
start: 2022-11-17 00:00:00
end: 2023-08-08 00:00:00
period: 1d
basePeriod: 1h
exchanges: [{"eid":"Futures_Binance","currency":"BTC_USDT"}]
*/

//@version=3
strategy("f.society v7", title="f.society v7", overlay=true)
//@Author: rick#1414
// -----------------------------------------------------
// f.society : Pone 3EMA: 5, 9, 21, 50, 100, 200, SAR,
// velas azules en sobreventa y velas moradas sobre compra
// SAR 0.02, 0.02, 0.2 , Bandas de Bollinger
// estrategia de compra y venta con rsi, macd o psr
// color de fondo: ema, rsi (color azul sobreventa 35, 25 (mas intenso))
// -----------------------------------------------------
// Como agregar a Trading view:
// 1 Cerrar todos los otros indicadores antes de añadirlo
// 2. Ir a la página de inicio TradingView.com
// 3. En la parte inferior, haga clic en Editor Pine // ver imagen: // https://cdn.discordapp.com/attachments/407267549047422976/407393815112974336/unknown.png
// 4. borrar todo el texo y reemplazar con todo el contenido de este archivo
// 5. Pulse el botón "Añadir a trazar" (Add to graph)
// -----------------------------------------------------
// revisar opciones de on y off segun indicadores deseados
// https://cdn.discordapp.com/attachments/405885820114042883/412115277883506700/unknown.png
// se puede cambiar la estrategia desde este menu desplegable para señales buy/sell

// Options
estrategia = input(defval="rsi", title = "Strategy", options=["ema","rsi","macd","psr","off","BB","ema5"])
in_bkcolor = input(defval="rsi", title = "background color", options=["ema","rsi","macd","psr","off","exchange","BB","ema5"])
e5 = input(title="Show ema5?", type=bool, defval=false)
e9 = input(title="Show ema9?", type=bool, defval=true)
e21 = input(title="Show ema21?", type=bool, defval=true)
e50 = input(title="Show ema50?", type=bool, defval=false)
e100 = input(title="Show ema100?", type=bool, defval=false)
e200 = input(title="Show ema200", type=bool, defval=true)
in_rsi = input(title="Color oversold and overbought bars?", type=bool, defval=true)
in_sar = input(title="Show Parabolic Sar", type=bool, defval=true)
in_bb = input(title="Show Bollinger Bands?", type=bool, defval=true)
sd = input(false, title="Show Daily Pivots?")
linew = input(1, title="linewidth", minval=0)
sarw = input(1, title="sar points width", minval=0)
ovs = input(40, title="oversold rsi", minval=0)
ovb = input(65, title="overbought rsi", minval=0)


//pf = input(false,title="Show Filtered Pivots")
pf=false

// 3 ema
src = close // input(close, title="Source")
//len9 = input(9, minval=1, title="ema9 Length")
//len21 = input(21, minval=1, title="ema21 Length")
//len200 = input(200, minval=1, title="ema200 Length")
len5=5
len9=9
len21=21
len50=50
len100=100
len200=200
ema5 = ema(src, len5)
ema9 = ema(src, len9)
ema21 = ema(src, len21)
ema50= ema(src, len50)
ema100 = ema(src, len100)
ema200 = ema(src, len200)
plot(e5? ema5 : na, title="EMA5", linewidth=linew, color=purple)
plot(e9? ema9 : na, title="EMA9", linewidth=linew, color=blue)
plot(e21? ema21 : na, title="EMA21", linewidth=linew, color=red)
plot(e50? ema50 : na, title="EMA50", linewidth=linew, color=green)
plot(e100? ema100 : na, title="EMA100", linewidth=linew, color=lime)
plot(e200? ema200 : na, title="EMA200", linewidth=linew, color=yellow)

// RSI Color
//lenR = input(14, minval=1, title="RSI Length")
lenR=14
//up = rma(max(change(src), 0), lenR)
//down = rma(-min(change(src), 0), lenR)
//vrsi = down == 0 ? 100 : up == 0 ? 0 : 100 - (100 / (1 + up / down))
vrsi=rsi(close,lenR)
//plot(vrsi,title="vrsi")
oversold = vrsi < ovs
overbought = vrsi > ovb
barcolor(in_rsi? oversold? #0000FF : overbought? #ff00ff:na : na)

// SAR
plot(in_sar? sar(0.02, 0.02, 0.2): na, style=cross, linewidth=sarw, color=blue, title="sar")

// BB
//length = input(20, title="Bollinger length", minval=1)
length=20
//mult = input(2.0, title="Bollinger stdDev", minval=0.001, maxval=50)
mult=2.0
basis = sma(src, length)
dev = mult * stdev(src, length)
upper = basis + dev
lower = basis - dev
plot(in_bb? basis :na, color=red, linewidth=linew, title="BB basis")
p1 = plot(in_bb? upper :na, color=blue, linewidth=linew, title="BB upper")
p2 = plot(in_bb? lower :na, color=blue, linewidth=linew, title="BB lower")
fill(p1, p2)

//background
bgcolor(in_bkcolor=="exchange"? #0000FF40 : in_bkcolor=="rsi"? vrsi < (ovs-15) ? #0000FF50  : vrsi < ovs ? #0000FF30 :( vrsi < ovb ? #ff00ff10 : #ff00ff20): in_bkcolor=="ema"?(ema9>ema21?#ff00ff10  : #0000FF20):in_bkcolor=="BB"?(lower>close?#ff00ff10 : close>upper?#0000FF20:#ff00ff10): in_bkcolor=="ema5"?(ema5>ema21?#ff00ff10  : #0000FF20):na)


// Strategy
if estrategia == "ema"
    strategy.entry("buy", true, 1, when= crossover(ema9,ema21) ),
    strategy.entry("sell", false, 1, when = crossover(ema21,ema9))
else
    if estrategia =="rsi"
        strategy.entry("buy", true, 1, when= vrsi <ovs),
        strategy.entry("sell", false, 1, when = vrsi > ovb or crossover(close,upper))
    else
        if estrategia =="macd"
            [macdLine, signalLine, histLine] = macd(close, 12, 26, 9),
            //bgcolor(macdLine > signalLine ? #98c8ff : #ff8b94),
            strategy.entry("buy", true, 1, when= macdLine>=signalLine ),
            strategy.entry("sell", false, 1, when = macdLine<signalLine)
        else
            if estrategia=="psr"
                leftBars = 4 //input(4)
                rightBars = 2 //input(2)
                swh = pivothigh(leftBars, rightBars)
                swl = pivotlow(leftBars, rightBars)
                swh_cond = not na(swh)
                hprice = 0.0
                hprice := swh_cond ? swh : hprice[1]
                le = false
                le := swh_cond ? true : (le[1] and high > hprice ? false : le[1])
                if (le)
                    strategy.entry("buy", strategy.long, comment="buy", stop=hprice + syminfo.mintick)
                swl_cond = not na(swl)
                lprice = 0.0
                lprice := swl_cond ? swl : lprice[1]
                se = false
                se := swl_cond ? true : (se[1] and low < lprice ? false : se[1])
                if (se)
                    strategy.entry("sell", strategy.short, comment="sell", stop=lprice - syminfo.mintick)
            else
                if estrategia=="BB"
                    strategy.entry("buy", true, 1, when= crossover(lower,close) ),
                    strategy.entry("sell", false, 1, when = crossover(close,upper))
                else
                    if estrategia=="ema5"
                        strategy.entry("buy", true, 1, when= crossover(ema5,ema21) ),
                        strategy.entry("sell", false, 1, when = crossover(ema21,ema5))


// pivots

// Classic Pivot
pivot = (high + low + close ) / 3.0
// Filter Cr
bull= pivot > (pivot + pivot[1]) / 2 + .0025
bear= pivot < (pivot + pivot[1]) / 2 - .0025
// Classic Pivots
r1 = pf and bear ? pivot + (pivot - low) : pf and bull ? pivot + (high - low) : pivot + (pivot - low)
s1 = pf and bull ? pivot - (high - pivot) : pf and bear ? pivot - (high - low) : pivot - (high - pivot)
r2 = pf ? na : pivot + (high - low)
s2 = pf ? na : pivot - (high - low)
//Pivot Average Calculation
smaP = sma(pivot, 3)
//Daily Pivots
dtime_pivot = request.security(syminfo.tickerid, 'D', pivot[1])
dtime_pivotAvg = request.security(syminfo.tickerid, 'D', smaP[1])
dtime_r1 = request.security(syminfo.tickerid, 'D', r1[1])
dtime_s1 = request.security(syminfo.tickerid, 'D', s1[1])
dtime_r2 = request.security(syminfo.tickerid, 'D', r2[1])
dtime_s2 = request.security(syminfo.tickerid, 'D', s2[1])
offs_daily = 0
plot(sd and dtime_pivot ? dtime_pivot : na, title="Daily Pivot",style=line, color=fuchsia,linewidth=linew)
plot(sd and dtime_r1 ? dtime_r1 : na, title="Daily R1",style=line, color=#DC143C,linewidth=linew)
plot(sd and dtime_s1 ? dtime_s1 : na, title="Daily S1",style=line, color=lime,linewidth=linew)
plot(sd and dtime_r2 ? dtime_r2 : na, title="Daily R2",style=line, color=maroon,linewidth=linew)
plot(sd and dtime_s2 ? dtime_s2 : na, title="Daily S2",style=line, color=#228B22,linewidth=linew)


// References:
// get number of bars since last green bar
//plot(barssince(close >= open), linewidth=3, color=blue)
//bgcolor(close < open ? #ff8b94   : #98c8ff , transp=10)
//http://www.color-hex.com/
//   #98c8ff    light blue
//    #ff8b94   red   #b21c0e
//       #7d1d90    purple
//    #0029ff blue
//    #fffa86   yellow