Estrategia de trading cuantitativo de triple supertendencia


Fecha de creación: 2023-12-01 16:43:02 Última modificación: 2023-12-01 16:43:02
Copiar: 0 Número de Visitas: 936
1
Seguir
1619
Seguidores

Estrategia de trading cuantitativo de triple supertendencia

Descripción general

La estrategia de comercio cuantitativo de triple tendencia es una estrategia de comercio de línea corta que combina tres indicadores de tendencia. La estrategia es adecuada para el comercio intradiario y el arbitraje de línea corta en mercados de alta frecuencia como criptomonedas, divisas y otros.

Principio de estrategia

  • Utiliza la media móvil de 200 días para determinar la dirección de la tendencia general del mercado. Los precios son más altos cuando suben y más bajos cuando bajan.
  • El uso de tres indicadores de hipertrend para determinar la dirección de la tendencia del segmento de mercado. El indicador de hipertrend puede determinar con precisión la tendencia del segmento de mercado.
  • El indicador de Stoch RSI, que utiliza la banda de Bryn para juzgar sobrecompra y sobreventa, construye una señal de entrada. El Stoch RSI puede identificar oportunidades de reversión.
  • De acuerdo con el stop loss de la tendencia, el stop stop de la tendencia determina un riesgo de retorno de 1.5 veces.

Ventajas estratégicas

  • Verificación de indicadores de múltiples tendencias para mejorar la precisión de la toma de decisiones.
  • Los indicadores de sobreventa y sobrecompra identifican las oportunidades de reversión y aprovechan el inicio de la misma.
  • El mecanismo de suspensión de pérdidas controla la relación entre el riesgo y los beneficios.
  • El espacio para obtener ganancias es amplio, ya que es adecuado para operaciones de corto alcance de alta frecuencia.

Riesgo estratégico

  • El riesgo de pérdidas en el corto plazo es mayor cuando el ciclo económico es desfavorable.
  • La probabilidad de fracaso en la inversión sigue siendo alta, lo que puede conducir a decisiones equivocadas.
  • Necesita una comercialización frecuente, no es adecuado para el comercio fuera del campo.

Optimización de la estrategia

  • Optimización de los parámetros de las medias móviles para adaptarse a períodos más largos.
  • Optimización de los parámetros del RSI de Stoch para reducir la tasa de señales erróneas.
  • Optimización de los parámetros de los ciclos ATR de tendencia excesiva para mejorar el efecto de parada de pérdidas.
  • Aumentar la gestión de las posiciones, incrementando las posiciones en función de la magnitud de las retiradas.

Resumir

La estrategia de comercio de cuantificación de tres trayectorias, el uso de múltiples indicadores de verificación de la tendencia para mejorar la precisión de la toma de decisiones, el control de stop loss y el riesgo de la ganancia, adecuado para el comercio de corta línea de alta frecuencia. Los parámetros de optimización se pueden adaptar a un ciclo de negociación más largo, reducir la probabilidad de emisión de señales erróneas y mejorar el efecto de stop loss.
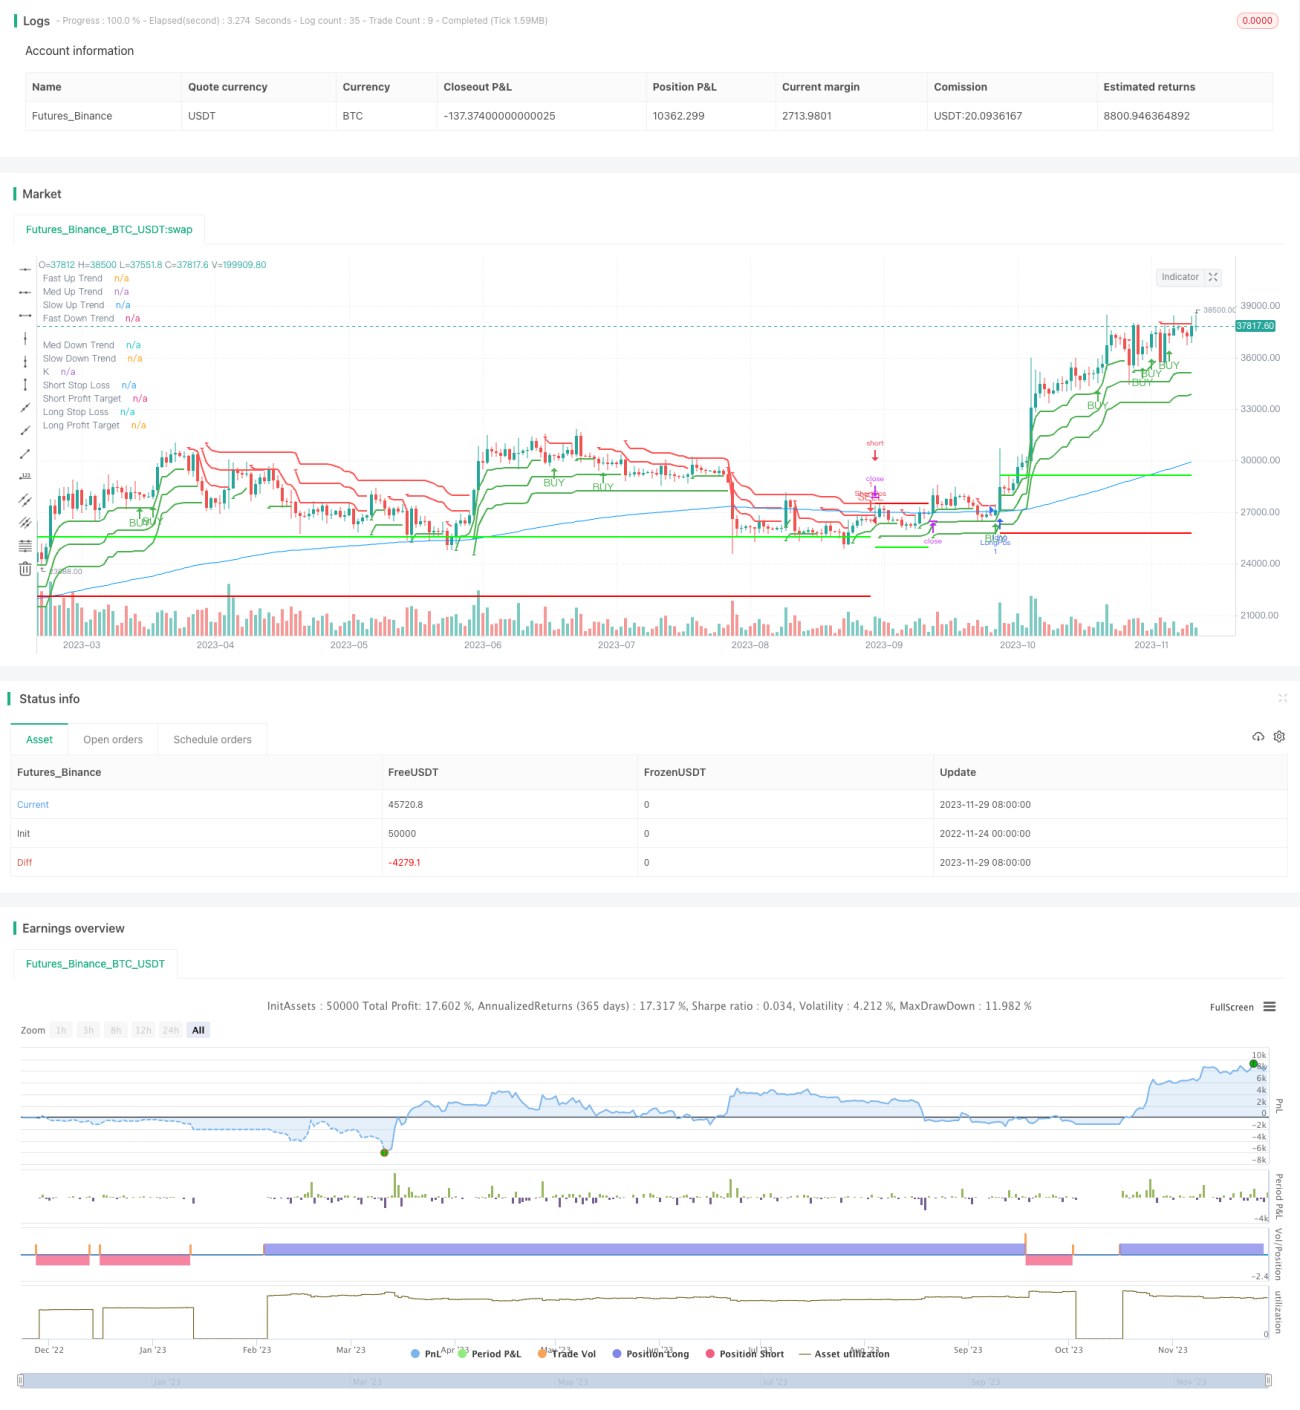
Código Fuente de la Estrategia
/*backtest
start: 2022-11-24 00:00:00
end: 2023-11-30 00:00:00
period: 1d
basePeriod: 1h
exchanges: [{"eid":"Futures_Binance","currency":"BTC_USDT"}]
*/

//@version=4
strategy("3x SuperTrend Strategy (Mel0nTek) V1", calc_on_every_tick=true, overlay=true)

// ***************************************************
//  A Mel0nTek Project
//  Author: mel0n
//  Revision: 1.0 - Initial Release
// ***************************************************

// ***************************************************
//              Strategy & Rules
// ***************************************************
// === Sources ===
// Strategy Idea:
// Trade Pro - HIGHEST PROFIT Triple Supertrend Trading Strategy Proven 100 Trade Results
// https://www.youtube.com/watch?v=HpNZ2VpZzSE
//
// Combining SuperTrend with StochRSI is not a new idea by any means.
// However the method/criteria used in his video to apply them caught my interest.
// So I decided to code it up for myself to do some backtesting.
// The default values are the ones he uses in his video, however I found some tuning beneficial. YMMV
// Trade Pro makes some great content, the video is a good watch to get a better understanding of this strategy.
//
// Improved SuperTrend Calculation Method:
// SuperTrend by KivancOzbilgic

// === Indicators ===
// EMA 
// @ 200
// Stoch RSI (default)
// @ 3, 3, 14, 14, close
// Supertrend slow
// @ 12, hl2, 3, change = true
// Supertrend med
// @ 11, hl2, 2, change = true
// Supertrend fast
// @ 10, hl2, 1, change = true

// === Rules ===
// long only 
// - price above EMA200
// short only 
// - price below EMA200
// Stop Loss = 2nd SuperTrend line above (short) or below(long) entry candle
// Profit = 1.5x SL/risk (Profit Ratio x Max Loss)

// === Entries ===
// LONG
// - long entry (Typical): 
// - Stoch RSI below 20, cross up
// - 2nd SuperTrend line below close

// SHORT
// - short entry (Typical): 
// - Stoch RSI above 80, cross down
// - 2nd SuperTrend line above close


// ***************************************************
// Backtest Parameters
// ***************************************************
testStartYear = input(2020, "Backtest Start Year")
testStartMonth = input(1, "Backtest Start Month")
testStartDay = input(1, "Backtest Start Day")
testPeriodStart = timestamp(testStartYear, testStartMonth, testStartDay, 0, 0)
timeCondition = time >= testPeriodStart
direction = input(0, title = "Strategy Direction", type=input.integer, minval=-1, maxval=1)
strategy.risk.allow_entry_in(direction == 0 ? strategy.direction.all : (direction < 0 ? strategy.direction.short : strategy.direction.long))

// ***************************************************
// Inputs
// ***************************************************
// P/L Ratio
plInput = input(1.5, title="P/L Ratio", step=0.1, minval=0.1)
// EMA
EMAInputlength = input(200, "EMA Length",step=100, minval=1)
// Stoch RSI
srsiInputSmoothK = input(3, "K", minval=1)
srsiInputSmoothD = input(3, "D", minval=1)
srsiInputLengthRSI = input(14, "Stoch RSI Length", minval=1)
srsiInputLengthStoch = input(14, "Stochastic Length", minval=1)
srsiInputSrc = input(close, title="Stoch RSI Source")
srsiInputThresh = input(20, title="Stoch RSI Entry Thresh", minval=1)
// SuperTrends
stInputSrc = input(hl2, title="SuperTrend Source")
stSlowInputLength = input(12, "Slow SuperTrend Length", minval=1)
stSlowInputMult = input(3, "Slow SuperTrend Multiplier", minval=1)
stMedInputLength = input(11, "Med SuperTrend Length", minval=1)
stMedInputMult = input(2, "Med SuperTrend Multiplier", minval=1)
stFastInputLength = input(10, "Fast SuperTrend Length", minval=1)
stFastInputMult = input(1, "Fast SuperTrend Multiplier", minval=1)
stInputchangeATR= input(title="Alternate SuperTrend ATR Calculation?", type=input.bool, defval=true)
// Toggles
showPLTargets = input(true, title="Show Open Profit/Loss Targets?")
showBuySell = input(true, title="Show Buy/Sell Indicators?")


// ***************************************************
// Indicator Functions
// ***************************************************
// SuperTrend Function
superTrend(period, src, mult, chgATR) =>
    stATRSmooth = sma(tr, period)                       // tr = true range
    stATR = chgATR ? atr(period) : stATRSmooth          // select ATR to use
    stUP = src - (mult * stATR)                         // up value
    stUP1 = nz(stUP[1], stUP)                           // prev candle value if not 0
    stUP := close[1] > stUP1 ? max(stUP,stUP1) : stUP   // select the larger up value if close is higher than previous up value
    stDN = src  + (mult * stATR)
    stDN1 = nz(stDN[1], stDN)
    stDN := close[1] < stDN1 ? min(stDN, stDN1) : stDN
    stTrend = 1
    stTrend := nz(stTrend[1], stTrend)
    stTrend := stTrend == -1 and close > stDN1 ? 1 : stTrend == 1 and close < stUP1 ? -1 : stTrend
    stBuySignal = stTrend == 1 and stTrend[1] == -1
    stSellSignal = stTrend == -1 and stTrend[1] == 1
    stChangeCond = stTrend != stTrend[1]
    [stUP, stDN, stTrend, stBuySignal, stSellSignal, stChangeCond]

// Stochastic RSI Function
stochRSI(smoothK, smoothD, lengthRSI, lengthStoch, src) =>
    rsiVal = rsi(src, lengthRSI)
    k = sma(stoch(rsiVal, rsiVal, rsiVal, lengthStoch), smoothK)
    d = sma(k, smoothD)
    [k, d]

// ***************************************************
// Data Calculation
// ***************************************************
// SuperTrend Slow
[stSlowUP, stSlowDN, stSlowTrend, stSlowBuy, stSlowSell, stSlowChanged] = superTrend(stSlowInputLength, stInputSrc, stSlowInputMult, stInputchangeATR)

// SuperTrend Medium
[stMedUP, stMedDN, stMedTrend, stMedBuy, stMedSell, stMedChanged] = superTrend(stMedInputLength, stInputSrc, stMedInputMult, stInputchangeATR)

// SuperTrend Fast
[stFastUP, stFastDN, stFastTrend, stFastBuy, stFastSell, stFastChanged] = superTrend(stFastInputLength, stInputSrc, stFastInputMult, stInputchangeATR)

// Stoch RSI
[srsiK, srsiD] = stochRSI(srsiInputSmoothK,srsiInputSmoothD,srsiInputLengthRSI,srsiInputLengthStoch,srsiInputSrc)

// EMA
emaVal = ema(close,EMAInputlength)

// ***************************************************
// Indicator Plots
// ***************************************************
// EMA
plot(emaVal, "K", color=#0094FF)

// SuperTrend Slow
plot(stSlowTrend == 1 ? stSlowUP : na, title="Slow Up Trend", style=plot.style_linebr, linewidth=2, color=color.green)
plotshape(stSlowBuy ? stSlowUP : na, title="Slow UpTrend Begins", location=location.absolute, style=shape.triangleup, size=size.tiny, color=color.green, transp=0)
plot(stSlowTrend == 1 ? na : stSlowDN, title="Slow Down Trend", style=plot.style_linebr, linewidth=2, color=color.red)
plotshape(stSlowSell ? stSlowDN : na, title="Slow DownTrend Begins", location=location.absolute, style=shape.triangledown, size=size.tiny, color=color.red, transp=0)

// SuperTrend Medium
plot(stMedTrend == 1 ? stMedUP : na, title="Med Up Trend", style=plot.style_linebr, linewidth=2, color=color.green)
plotshape(stMedBuy ? stMedUP : na, title="Med UpTrend Begins", location=location.absolute, style=shape.triangleup, size=size.tiny, color=color.green, transp=0)
plot(stMedTrend == 1 ? na : stMedDN, title="Med Down Trend", style=plot.style_linebr, linewidth=2, color=color.red)
plotshape(stMedSell ? stMedDN : na, title="Med DownTrend Begins", location=location.absolute, style=shape.triangledown, size=size.tiny, color=color.red, transp=0)

// SuperTrend Fast
plot(stFastTrend == 1 ? stFastUP : na, title="Fast Up Trend", style=plot.style_linebr, linewidth=2, color=color.green)
plotshape(stFastBuy ? stFastUP : na, title="Fast UpTrend Begins", location=location.absolute, style=shape.triangleup, size=size.tiny, color=color.green, transp=0)
plot(stFastTrend == 1 ? na : stFastDN, title="Fast Down Trend", style=plot.style_linebr, linewidth=2, color=color.red)
plotshape(stFastSell ? stFastDN : na, title="Fast DownTrend Begins", location=location.absolute, style=shape.triangledown, size=size.tiny, color=color.red, transp=0)

// Stoch RSI
// plot(srsiK, "K", color=#0094FF)
// plot(srsiD, "D", color=#FF6A00)
// h0 = hline(80, "Upper Band", color=#606060)
// h1 = hline(20, "Lower Band", color=#606060)
// fill(h0, h1, color=#9915FF, transp=80, title="Background")

// ***************************************************
// Conditional Logic
// ***************************************************
// common vars
float longStop = na
float longProfit = na
float shortStop = na
float shortProfit = na

// check EMA to determine long/short side trading
emaTrend = emaVal < close ? 1 : -1

// count how many supertrends are above/below
stCount = 0
stCount := stFastTrend + stMedTrend + stSlowTrend

// LONG
// - long entry (Typical): 
// - Stoch RSI below 20, cross up
// - 2 ST's below close
stochLongCond = srsiK < srsiInputThresh and crossover(srsiK, srsiD)
stLongCond = stCount >= 1
longCondition = emaTrend > 0 and stochLongCond and stLongCond

tempStopLong = longCondition ? stCount == 3 ? stMedUP : stSlowUP : longStop
longStopDelta = abs(close - tempStopLong)
tempProfitLong = longCondition ? close + (plInput * longStopDelta) : longProfit

longStop := strategy.position_size <= 0 ? longCondition ? tempStopLong : na : longStop[1]
longProfit := strategy.position_size <= 0 ? longCondition ? tempProfitLong : na : longProfit[1]

// SHORT
// - short entry (Typical): 
// - Stoch RSI above 80, cross down
// - 2 ST's above close
stochShortCond = srsiK > 100 - srsiInputThresh and crossunder(srsiK, srsiD)
stShortCond = stCount <= -1
shortCondition = emaTrend < 0 and stochShortCond and stShortCond

tempStopShort = shortCondition ? stCount == -3 ? stMedDN : stSlowDN : shortStop
shortStopDelta = abs(close - tempStopShort)
tempProfitShort = shortCondition ? close - (plInput * shortStopDelta) : shortProfit

shortStop := strategy.position_size >= 0 ? shortCondition ? tempStopShort : na : shortStop[1]
shortProfit := strategy.position_size >= 0 ? shortCondition ? tempProfitShort : na : shortProfit[1]

// ***************************************************
// Strategy Execution
// ***************************************************
strategy.exit("TP/SL", "LongPos", stop=longStop, limit=longProfit) 
strategy.exit("TP/SL", "ShortPos", stop=shortStop, limit=shortProfit) 

if (longCondition)
	strategy.entry("LongPos", strategy.long, stop=longStop, oca_name="3xST", comment="Long")
else
	strategy.cancel(id="LongPos")
if (shortCondition)
	strategy.entry("ShortPos", strategy.short, stop=shortStop, oca_name="3xST", comment="Short")
else
	strategy.cancel(id="ShortPos")

// ***************************************************
// Strategy Plotting
// ***************************************************
// profit/loss target lines
plot(showPLTargets ? strategy.position_size <= 0 ? na : longStop : na, title="Long Stop Loss", color=color.new(#ff0000, 0), style=plot.style_linebr, linewidth=2)
plot(showPLTargets ? strategy.position_size <= 0 ? na : longProfit : na, title="Long Profit Target", color=color.new(#00ff00, 0), style=plot.style_linebr, linewidth=2)
plot(showPLTargets ? strategy.position_size >= 0 ? na : shortStop : na, title="Short Stop Loss", color=color.new(#ff0000, 0), style=plot.style_linebr, linewidth=2)
plot(showPLTargets ? strategy.position_size >= 0 ? na : shortProfit : na, title="Short Profit Target", color=color.new(#00ff00, 0), style=plot.style_linebr, linewidth=2)
// buy/sell arrows
plotshape(showBuySell and longCondition ? true : na, title='Buy Arrow',  location=location.belowbar, color=color.green,   style=shape.arrowup,   text="BUY",  textcolor=color.green, transp=0, size=size.small)
plotshape(showBuySell and shortCondition ? true : na, title='Sell Arrow', location=location.abovebar, color=color.red,     style=shape.arrowdown, text="SELL", textcolor=color.red,   transp=0, size=size.small)

// ***************************************************
// Alerts (for use in a study)
// ***************************************************
alertcondition(longCondition, title="3xST Buy alert", message="Buy")
alertcondition(shortCondition, title="3xST SELL alert", message="Sell")
alertcondition(stSlowChanged, title="3xST Slow Trend alert", message="Slow Trend Changed")