Estrategia de seguimiento de tendencias basada en TFO y ATR para detener pérdidas

El autor:¿ Qué pasa?, Fecha: 2023-12-04 13:32:41
Las etiquetas:

img

Resumen general

Esta estrategia está diseñada basándose en el Dr. John Ehlers' Trend Flex Oscillator (TFO) y los indicadores Average True Range (ATR). Es adecuada para los mercados alcistas y abrirá posiciones largas cuando la acción del precio de sobreventa parezca revertirse. Por lo general cierra posiciones en unos pocos días a menos que sea atrapada en un mercado bajista, en cuyo caso se mantiene.

Estrategia lógica

Esta estrategia combina los indicadores TFO y ATR para determinar las entradas y salidas.

Condiciones de entrada: Cuando el TFO desciende por debajo de un umbral (lo que indica niveles de sobreventa) y el TFO ha subido desde la barra anterior (lo que indica una reversión al alza del TFO) y el ATR está por encima de un umbral de volatilidad establecido (lo que indica una volatilidad creciente del mercado), se abren posiciones largas.

Condiciones de salida: Cuando TFO se eleva por encima de un umbral (indicando niveles de sobrecompra) y ATR está por encima de un umbral establecido, todas las posiciones largas se cierran. Además, una parada de pérdida de seguimiento sale de todas las posiciones cuando el precio cae por debajo del nivel de parada de seguimiento. Los usuarios pueden elegir permitir que la estrategia salga basándose en señales de indicadores o basándose únicamente en la parada de pérdida.

La estrategia permite hasta 15 posiciones largas simultáneas. Los parámetros se pueden ajustar para diferentes plazos.

Ventajas

  1. La combinación de análisis de tendencia y volatilidad proporciona señales estables.

  2. Los parámetros de entrada, salida y stop loss ajustables proporcionan flexibilidad. Los usuarios pueden optimizar según las condiciones del mercado.

  3. Las pérdidas de parada incorporadas protegen contra movimientos extremos.

  4. El apoyo a la pirámide y las salidas parciales permite la composición de ganancias en los mercados alcistas.

Los riesgos

  1. Sólo largo, sin mecanismo de venta corta, no puede beneficiarse de los mercados en caída, los mercados bajistas severos pueden causar pérdidas enormes.

  2. Una mala sintonización de los parámetros puede causar exceso de negociación o entradas y salidas perdidas.

  3. En movimientos extremos, el stop loss puede fallar y no evitar grandes pérdidas.

  4. Las pruebas de retroceso no reflejan plenamente el rendimiento en vivo.

Oportunidades de mejora

  1. Se puede añadir una línea de stop loss móvil para salidas oportunas y una mejor protección a la baja.

  2. Se puede añadir un mecanismo de cortocircuito para permitir obtener beneficios durante las caídas del mercado cuando el TFO se invierte hacia abajo y el ATR es lo suficientemente alto.

  3. Más filtros como el cambio de volumen pueden reducir los impactos de los movimientos erráticos de los precios.

  4. Se pueden probar diferentes plazos y parámetros para encontrar la combinación de mejor rendimiento.

Conclusión

Esta estrategia combina las fortalezas del análisis de tendencia y volatilidad utilizando TFO y ATR para determinar la dirección del mercado. Mecanismos como piramidado, cierre parcial y stop loss de seguimiento permiten la composición de ganancias mientras se controla el riesgo durante los mercados alcistas. Hay margen para mejoras a través de más filtros de indicadores y optimización de parámetros.
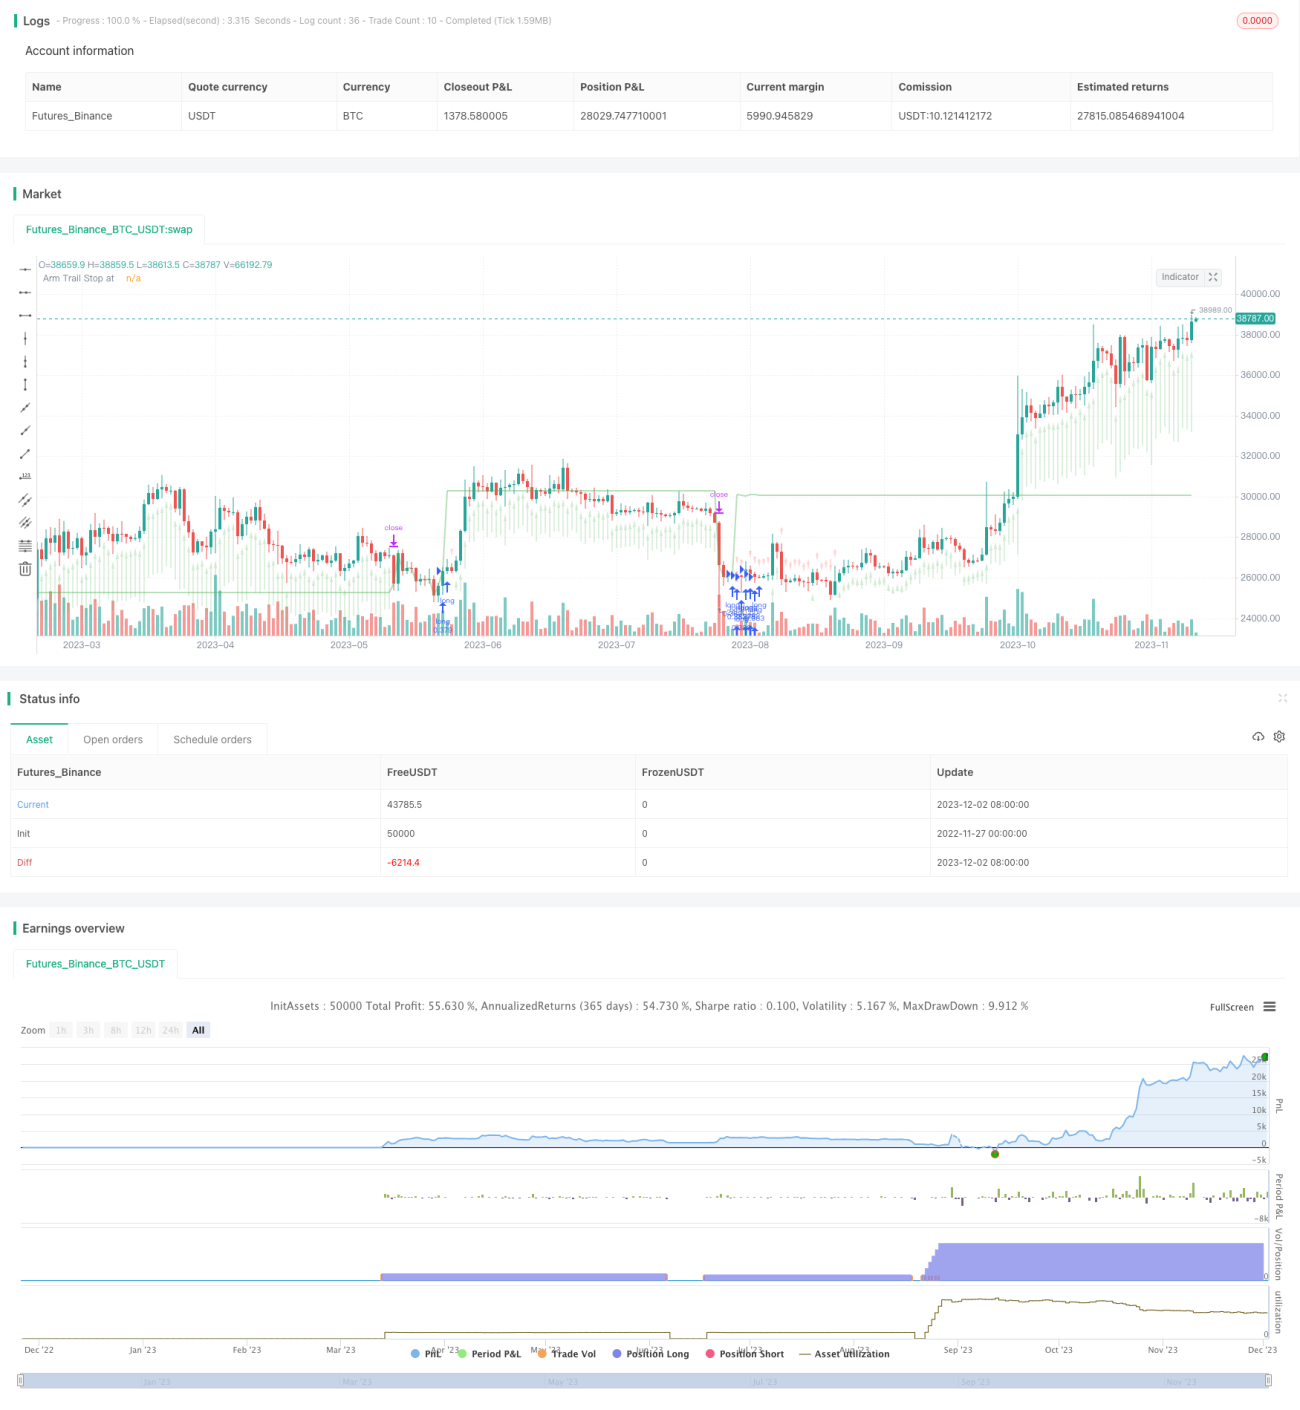
 Logra los objetivos básicos de una estrategia cuántica y merece más investigación y aplicación.


/*backtest
start: 2022-11-27 00:00:00
end: 2023-12-03 00:00:00
period: 1d
basePeriod: 1h
exchanges: [{"eid":"Futures_Binance","currency":"BTC_USDT"}]
*/

// This source code is subject to the terms of the Mozilla Public License 2.0 at https://mozilla.org/MPL/2.0/
// © Chart0bserver 
//
// Open Source attributions:
// portions © allanster (date window code)
// portions © Dr. John Ehlers (Trend Flex Oscillator)
//
// READ THIS CAREFULLY!!! ----------------//
// This code is provided for educational purposes only.  The results of this strategy should not be considered investment advice.
// The user of this script acknolwedges that it can cause serious financial loss when used as a trading tool
// This strategy has a bias for HODL (Holds on to Losses) meaning that it provides NO STOP LOSS protection! 
// Also note that the default behavior is designed for up to 15 open long orders, and executes one order to close them all at once. 
// Opening a long position is predicated on The Trend Flex Oscillator (TFO) rising after being oversold, and ATR above a certain volatility threshold.
// Closing a long is handled either by TFO showing overbought while above a certain ATR level, or the Trailing Stop Loss.  Pick one or both.
// If the strategy is allowed to sell before a Trailing Stop Loss is triggered, you can set a "must exceed %".  Do not mistake this for a stop loss.
// Short positions are not supported in this version.  Back-testing should NEVER be considered an accurate representation of actual trading results.

//@version=5
strategy('TFO + ATR Strategy with Trailing Stop Loss', 'TFO ATR Trailing Stop Loss', overlay=true, pyramiding=15, default_qty_type=strategy.cash, default_qty_value=10000, initial_capital=150000, currency='USD', commission_type=strategy.commission.percent, commission_value=0.5)
strategy.risk.allow_entry_in(strategy.direction.long)  // There will be no short entries, only exits from long.

// -----------------------------------------------------------------------------------------------------------//
// Back-testing Date Range code  ----------------------------------------------------------------------------//
// ---------------------------------------------------------------------------------------------------------//
fromMonth = input.int(defval=9, title='From Month', minval=1, maxval=12, group='Back-Testing Start Date')
fromDay = input.int(defval=1, title='From Day', minval=1, maxval=31, group='Back-Testing Start Date')
fromYear = input.int(defval=2021, title='From Year', minval=1970, group='Back-Testing Start Date')
thruMonth = 1       //input(defval = 1,    title = "Thru Month",      type = input.integer, minval = 1, maxval = 12, group="Back-Testing Date Range")
thruDay = 1         //input(defval = 1,    title = "Thru Day",        type = input.integer, minval = 1, maxval = 31, group="Back-Testing Date Range")
thruYear = 2112     //input(defval = 2112, title = "Thru Year",       type = input.integer, minval = 1970, group="Back-Testing Date Range")

// === FUNCTION EXAMPLE ===
start = timestamp(fromYear, fromMonth, fromDay, 00, 00)  // backtest start window
finish = timestamp(thruYear, thruMonth, thruDay, 23, 59)  // backtest finish window
window() =>  // create function "within window of time
    time >= start and time <= finish ? true : false
// Date range code -----//


// -----------------------------------------------------------------------------------------------------------//
// ATR Indicator Code  --------------------------------------------------------------------------------------//
// ---------------------------------------------------------------------------------------------------------//
length = 18  //input(title="ATR Length", defval=18, minval=1)
Period = 18  //input(18,title="ATR EMA Period")  

basicEMA = ta.ema(close, length)
ATR_Function = ta.ema(ta.tr(true), length)
EMA_ATR = ta.ema(ATR_Function, Period)
ATR = ta.ema(ta.tr(true), length)
ATR_diff = ATR - EMA_ATR
volatility = 100 * ATR_diff / EMA_ATR  // measure of spread between ATR and EMA
volatilityAVG = math.round((volatility + volatility[1] + volatility[2]) / 3)
buyVolatility = input.int(3, 'Min Volatility for Buy', minval=-20, maxval=20, step=1, group='Average True Range')
sellVolatility = input.int(13, 'Min Volatility for Sell', minval=-10, maxval=20, step=1, group='Average True Range')
useAvgVolatility = input.bool(defval=false, title='Average the Volatility over 3 bars', group='Average True Range')
// End of ATR  ------------/


// -----------------------------------------------------------------------------------------------------------//
// TFO Indicator code  --------------------------------------------------------------------------------------//
// ---------------------------------------------------------------------------------------------------------//
trendflex(Series, PeriodSS, PeriodTrendFlex, PeriodEMA) =>
    var SQRT2xPI = math.sqrt(8.0) * math.asin(1.0)  // 4.44288293815 Constant
    alpha = SQRT2xPI / PeriodSS
    beta = math.exp(-alpha)
    gamma = -beta * beta
    delta = 2.0 * beta * math.cos(alpha)
    float superSmooth = na
    superSmooth := (1.0 - delta - gamma) * (Series + nz(Series[1])) * 0.5 + delta * nz(superSmooth[1]) + gamma * nz(superSmooth[2])
    E = 0.0
    for i = 1 to PeriodTrendFlex by 1
        E += superSmooth - nz(superSmooth[i])
        E
    epsilon = E / PeriodTrendFlex
    zeta = 2.0 / (PeriodEMA + 1.0)
    float EMA = na
    EMA := zeta * epsilon * epsilon + (1.0 - zeta) * nz(EMA[1])
    return_1 = EMA == 0.0 ? 0.0 : epsilon / math.sqrt(EMA)
    return_1

upperLevel = input.float(1.2, 'TFO Upper Level', minval=0.1, maxval=2.0, step=0.1, group='Trend Flex Ocillator')
lowerLevel = input.float(-0.9, 'TFO Lower Level', minval=-2.0, maxval=-0.1, step=0.1, group='Trend Flex Ocillator')
periodTrendFlex = input.int(14, 'TrendFlex Period', minval=2, group='Trend Flex Ocillator')
useSuperSmootherOveride = true  //input( true, "Apply SuperSmoother Override Below*", input.bool, group="Trend Flex Ocillator")
periodSuperSmoother = 8.0       //input(8.0, "SuperSmoother Period*", input.float  , minval=4.0, step=0.5, group="Trend Flex Ocillator")
postSmooth = 33                 //input(33.0, "Post Smooth Period**", input.float  , minval=1.0, step=0.5, group="Trend Flex Ocillator")

trendFlexOscillator = trendflex(close, periodSuperSmoother, periodTrendFlex, postSmooth)
// End of TFO -------------//


// -----------------------------------------------------------------------------------------------------------//
// HODL Don't sell if losing n% ---------------------------------------------------------------------------- //
// ---------------------------------------------------------------------------------------------------------// 
sellOnStrategy = input.bool(defval=true, title='Allow Stategy to close positions', group='Selling Conditions')
doHoldLoss = true       // input(defval = true, title = "Strategy can sell for a loss", type = input.bool, group="Selling Conditions")
holdLoss = input.int(defval=0, title='Value (%) must exceed ', minval=-25, maxval=10, step=1, group='Selling Conditions')
totalInvest = strategy.position_avg_price * strategy.position_size
openProfitPerc = strategy.openprofit / totalInvest
bool acceptableROI = openProfitPerc * 100 > holdLoss
// -----------------------//


// -----------------------------------------------------------------------------------------------------------//
// Buying and Selling conditions  -------------------------------------------------------------------------- //
// ---------------------------------------------------------------------------------------------------------//    
if useAvgVolatility
    volatility := volatilityAVG
    volatility
tfoBuy = trendFlexOscillator < lowerLevel and trendFlexOscillator[1] < trendFlexOscillator  // Always make a purchase if TFO is in this lowest range
atrBuy = volatility > buyVolatility
tfoSell = ta.crossunder(trendFlexOscillator, upperLevel)
consensusBuy = tfoBuy and atrBuy
consensusSell = tfoSell and volatility > sellVolatility
if doHoldLoss
    consensusSell := consensusSell and acceptableROI
    consensusSell
// --------------------//


// -----------------------------------------------------------------------------------------------------------//
// Tracing & Debugging --------------------------------------------------------------------------------------//
// ---------------------------------------------------------------------------------------------------------//

plotchar(strategy.opentrades, 'Number of open trades', ' ', location.top)
plotarrow(100 * openProfitPerc, 'Profit on open longs', color.new(color.green, 75), color.new(color.red, 75))
// plotchar(strategy.position_size, "Shares on hand", " ", location.top)
// plotchar(totalInvest, "Total Invested", " ", location.top)
// plotarrow(strategy.openprofit, "Open profit dollar amount", color.new(color.green,100), color.new(color.red, 100))
// plotarrow(strategy.netprofit, "Net profit for session", color.new(color.green,100), color.new(color.red, 100))
// plotchar(acceptableROI, "Acceptable ROI", " ", location.top)
// plotarrow(volatility, "ATR volatility value", color.new(color.green,75), color.new(color.red, 75))
// plotchar(strategy.position_avg_price, "Avgerage price of holdings", " ", location.top)
// plotchar(volatilityAVG, "AVG volatility", " ", location.top)
// plotchar(fiveBarsVal, "change in 5bars", " ", location.top)
// plotchar(crossingUp, "crossingUp", "x",  location.belowbar, textcolor=color.white)
// plotchar(crossingDown, "crossingDn", "x",  location.abovebar, textcolor=color.white)
// plotchar(strategy.closedtrades, "closedtrades", " ", location.top)
// plotchar(strategy.wintrades, "wintrades", " ", location.top)
// plotchar(strategy.losstrades, "losstrades", " ", location.top)
// plotchar(close, "close", " ", location.top)
//--------------------//

// -----------------------------------------------------------------------------------------------------------//
// Trade Alert Execution ------------------------------------------------------------------------------------//
// ---------------------------------------------------------------------------------------------------------//

strategy.entry('long', strategy.long, when=window() and consensusBuy, comment='long')
if sellOnStrategy
    strategy.close('long', when=window() and consensusSell, qty_percent=100, comment='Strat')


// -----------------------------------------------------------------------------------------------------------//
// Trailing Stop Loss logic -------------------------------------------------------------------------------- //
// ---------------------------------------------------------------------------------------------------------//    
useTrailStop = input.bool(defval=true, title='Set Trailing Stop Loss on avg positon value', group='Selling Conditions')
arm = input.float(defval=15, title='Trailing Stop Arms At (%)', minval=1, maxval=30, step=1, group='Selling Conditions') * 0.01
trail = input.float(defval=2, title='Trailing Stop Loss (%)', minval=0.25, maxval=9, step=0.25, group='Selling Conditions') * 0.1

longStopPrice = 0.0
stopLossPrice = 0.0

if strategy.position_size > 0
    longStopPrice := strategy.position_avg_price * (1 + arm)
    stopLossPrice := strategy.position_avg_price * ((100 - math.abs(holdLoss)) / 100)  // for use with 'stop' in strategy.exit
    stopLossPrice
else
    longStopPrice := close
    longStopPrice

// If you want to hide the Trailing Stop Loss threshold (green line), comment this out
plot(longStopPrice, 'Arm Trail Stop at', color.new(color.green, 60), linewidth=2)

if strategy.position_size > 0 and useTrailStop
    strategy.exit('exit', 'long', when=window(), qty_percent=100, trail_price=longStopPrice, trail_offset=trail * close / syminfo.mintick, comment='Trail')

//-----------------------------------------------------------------------------------------------------------//


Más.