Estrategia de señal de compra con filtro de compra e indicador dual

Descripción general
La estrategia utiliza una combinación de índices aleatorios como las medias móviles lisas (Stochastic RSI) y el indicador de las bandas de Brin para identificar posibles oportunidades de compra. La estrategia utiliza varias condiciones de filtración para distinguir los puntos de compra más rentables. Esto le permite identificar momentos de compra de alta probabilidad en un entorno de fluctuación del mercado.
Principio de estrategia
La estrategia utiliza dos conjuntos de indicadores para identificar las oportunidades de compra.
En primer lugar, se utiliza un índice aleatorio para determinar si el mercado está sobrevendido. El indicador, combinado con el índice aleatorio y su promedio móvil, se considera una señal de sobreventa cuando la línea% K cruza su línea% D desde el punto más bajo. Aquí se establece un umbral, que se considera sobrevendido cuando la línea% K es superior a 20.
En segundo lugar, la estrategia utiliza el indicador de la banda de Brin para identificar los cambios en el precio. La banda de Brin es el descenso y el descenso del precio en función de la diferencia estándar. Cuando el precio se acerca a la descenso, se trata de un estado de sobreventa.
Una vez que se obtienen las señales de sobreventa de los dos indicadores anteriores, la estrategia agrega múltiples condiciones de filtrado para identificar aún más el momento de comprar:
- El precio apenas rompió con Brin y subió por debajo de la línea.
- El precio de cierre actual es mayor que el precio de cierre anterior a la línea N <unk> K, mostrando la entrada de compra
- Los precios de cierre actuales están por debajo de los precios de cierre a largo o mediano plazo, lo que favorece la corrección
La hora de compra identificada después del juicio integral, emite una señal de compra.
Análisis de las ventajas
La estrategia de filtrado de doble indicador tiene varias ventajas:
- El uso de un doble indicador de juicio hace que las señales de compra sean más confiables y evita falsas señales.
- Las condiciones de filtración son múltiples para evitar compras frecuentes en situaciones de crisis.
- La combinación de indicadores de índices aleatorios para determinar el estado de sobreventa y el indicador de la banda de Bryn para determinar el precio anormal.
- Aumentar la capacidad de evaluación de precios y asegurar que haya suficientes entradas para los compradores.
- Aumentar el juicio de retroceso para asegurar aún más la fiabilidad de los puntos de compra.
En general, la estrategia utiliza una combinación de indicadores técnicos y filtros que permiten una identificación más precisa y confiable de la hora de compra, lo que permite un mejor desempeño de las operaciones.
Análisis de riesgos
A pesar de las ventajas de esta estrategia de filtrado de doble indicador, también existen algunos riesgos que deben evitarse:
- La configuración incorrecta de los parámetros puede causar que las señales de compra sean demasiado frecuentes o conservadoras y requieren una prueba y optimización cuidadosas.
- Las condiciones de filtración múltiple pueden haber perdido algunas oportunidades de compra y no permitir el seguimiento rápido de la situación.
- Cuando los indicadores se dispersan, se producen señales erróneas, por lo que es necesario prestar atención a la coherencia de los indicadores.
- La falta de conocimiento de la tendencia puede generar señales erróneas en un mercado bajista y causar pérdidas.
Para los riesgos mencionados, la estrategia puede optimizarse de la siguiente manera:
- Ajuste los parámetros del indicador para equilibrar la sensibilidad de las condiciones de filtración.
- La ayuda de los indicadores de tendencia para evitar señales erróneas en los mercados bajistas.
- Aumentar las medidas de contención de pérdidas
Dirección de optimización
La estrategia de filtrado de doble indicador puede optimizarse aún más en las siguientes dimensiones:
- Prueba más combinaciones de indicadores técnicos para encontrar mejores medios para determinar el momento de compra. Por ejemplo, VRSI, DMI, etc.
- Se añaden algoritmos de aprendizaje automático para optimizar automáticamente los parámetros.
- Aumentar el mecanismo de suspensión de pérdidas. Aumentar gradualmente la línea de suspensión de pérdidas cuando las ganancias alcanzan un cierto nivel.
- En combinación con los indicadores de volumen de transacciones, asegúrese de que haya suficiente poder adquisitivo.
- Optimización de las estrategias de gestión de fondos. Establecimiento de un número dinámico de operaciones para reducir las pérdidas individuales.
Mediante la introducción de técnicas y métodos más avanzados, la estrategia de filtración de doble indicador permite una selección de compra más precisa y una mayor capacidad de control de riesgo. Por lo tanto, se obtienen ganancias más estables y fiables en el mercado real.
Resumir
En resumen, la estrategia de compra de señales de compra de doble indicador utiliza varios indicadores técnicos, como el RSI estocástico y las bandas de Brin, y combina una serie de condiciones de filtración, como la fuerza del precio y el juicio de reajuste, para identificar un momento de compra con una alta probabilidad de confianza. Si se perfecciona aún más con la optimización de parámetros, la configuración de stop loss, etc., la estrategia puede convertirse en una de las estrategias de negociación cuantitativa de estabilidad de ganancias.
Su principal ventaja es la combinación eficaz de indicadores y condiciones de filtración, lo que hace que el momento de compra sea más preciso. El riesgo y la dirección de optimización también pueden ser controlados y resueltos. En general, es una estrategia de cuantificación eficiente que se puede implementar.
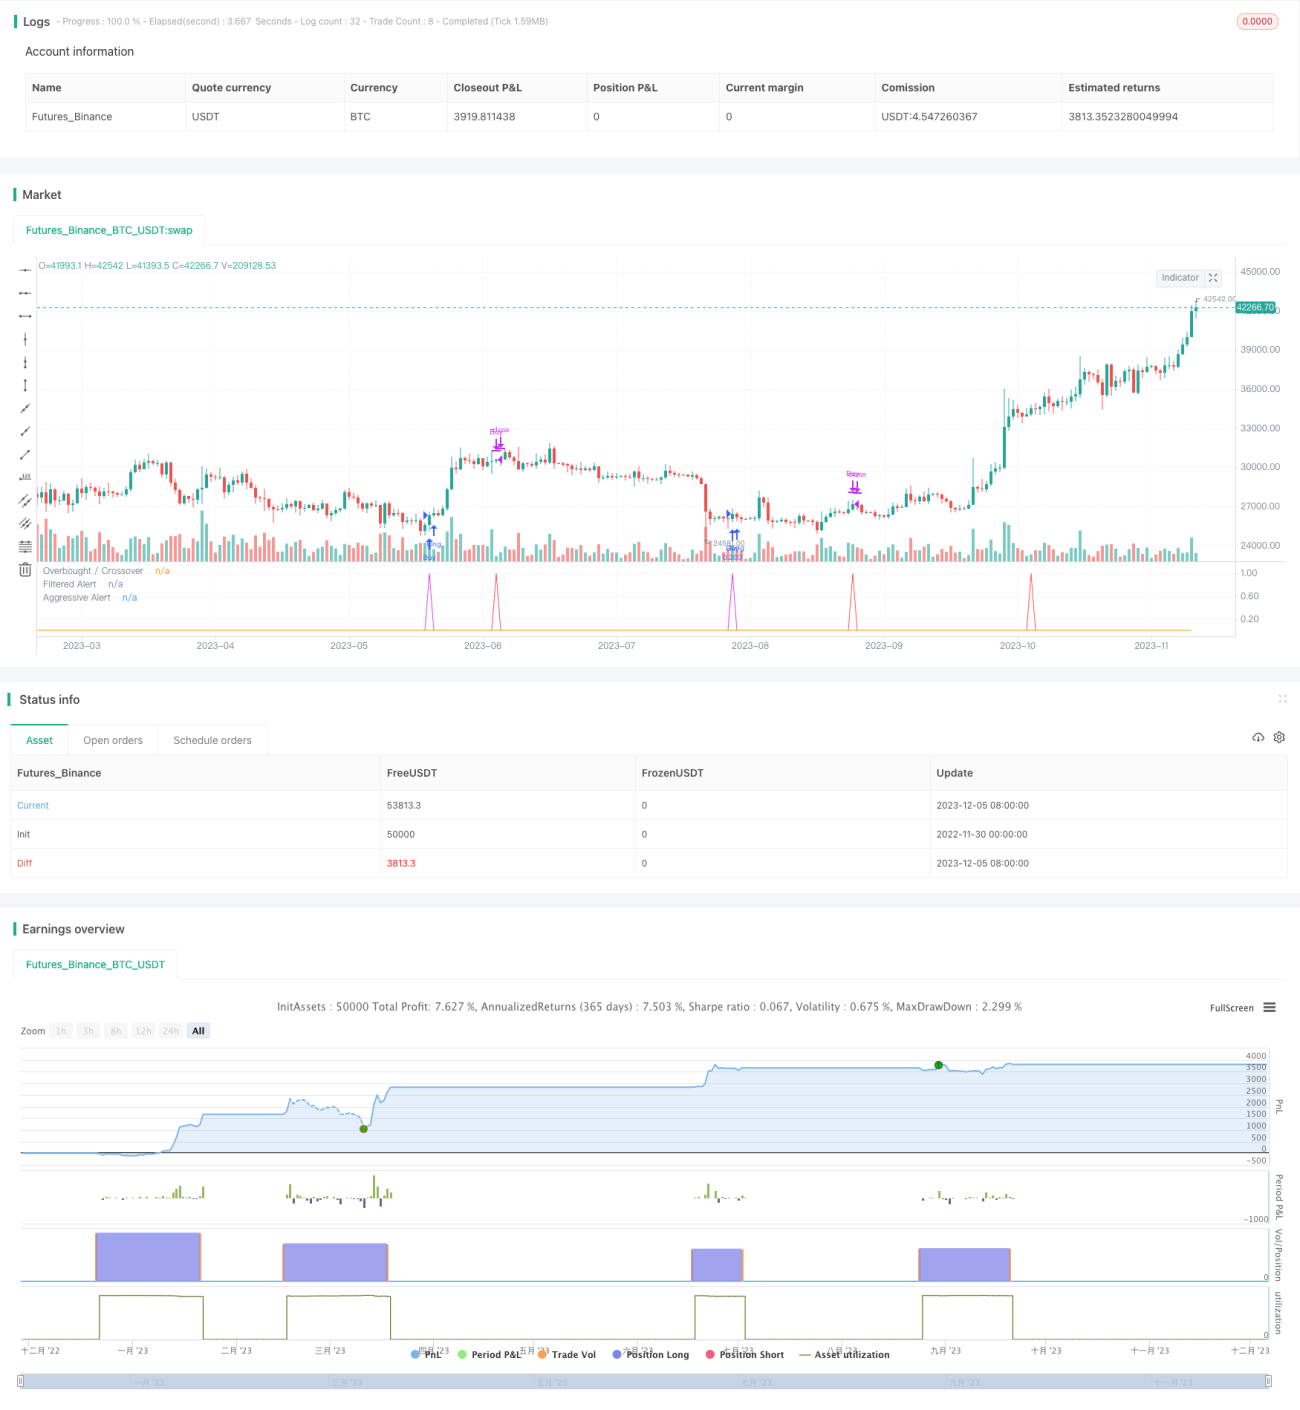
/*backtest
start: 2022-11-30 00:00:00
end: 2023-12-06 00:00:00
period: 1d
basePeriod: 1h
exchanges: [{"eid":"Futures_Binance","currency":"BTC_USDT"}]
*/

//@version=4
strategy("SORAN Buy and Close Buy", pyramiding=1, initial_capital=10000, default_qty_type=strategy.percent_of_equity, default_qty_value=10, overlay=false)

////Buy and Close-Buy messages- 1