Estrategia de ruptura de precio fraccional estándar

Descripción general
Z-Score Price Breakout Strategy utiliza el indicador de puntaje estándar del precio para determinar si el precio actual está en un estado anormal, lo que genera una señal de negociación. Cuando el puntaje estándar del precio es superior o inferior a un determinado umbral, indica que el precio ha entrado en un estado anormal, en el que se puede hacer más o menos operaciones.
Principio de estrategia
El indicador central de la estrategia es el puntaje estándar de precios (Z-Score), cuya fórmula de cálculo es la siguiente:
mylang
Z_score = (C - SMA(n)) / StdDev(C,n)
Donde C es el precio de cierre, SMA (n) es el promedio móvil simple de n ciclos, StdDev (C, n) es la diferencia estándar del precio de cierre de n ciclos.
El puntaje estándar refleja el grado de desviación entre el precio actual y el precio promedio. Cuando el puntaje estándar de precio es mayor que un determinado umbral positivo (por ejemplo, +2), indica que el precio actual ya está por encima de 2 puntos de diferencia entre el precio promedio y pertenece a un nivel más alto; cuando es menor que un determinado umbral negativo (por ejemplo, -2), indica que el precio actual ya está por debajo de 2 puntos de diferencia entre el precio promedio y pertenece a un nivel más bajo.
La estrategia primero calcula el puntaje estándar del precio y luego establece un umbral positivo-negativo (como 0 y 0), que genera una señal de compra cuando el puntaje estándar es superior al umbral positivo y una señal de venta cuando es inferior al umbral negativo.
Análisis de las ventajas
- El uso de un puntaje estándar de precios para determinar una anomalía de precio es una forma común y eficaz de cuantificación.
- Se pueden realizar fácilmente operaciones binarias de venta y ventaja
- Configuración de parámetros flexibles, que se pueden ajustar con periodicidad, valores de umbral, etc.
- Se puede combinar con otros indicadores para formar un sistema de negociación
Análisis de riesgos
- Las estrategias de puntaje estándar son más expansivas y más propensas a generar falsas señales.
- Es necesario configurar los parámetros adecuados, como el ciclo y el umbral
- Las estrategias de control de pérdidas deben tener en cuenta el riesgo
Dirección de optimización
- Optimización de los parámetros de ciclo para encontrar el ciclo óptimo
- Optimización de los umbrales positivos y negativos para reducir las señales falsas
- Aumentar las condiciones de filtración en combinación con otros indicadores
- Aumentar las estrategias de alto riesgo
Resumir
La estrategia de ruptura de precios de los parámetros estándares determina si el precio actual está en un estado anormal y se negocia en función de los puntos positivos y negativos de los parámetros de precios. La estrategia es sencilla y fácil de manejar, se puede negociar en ambos sentidos, pero también existe cierto riesgo.
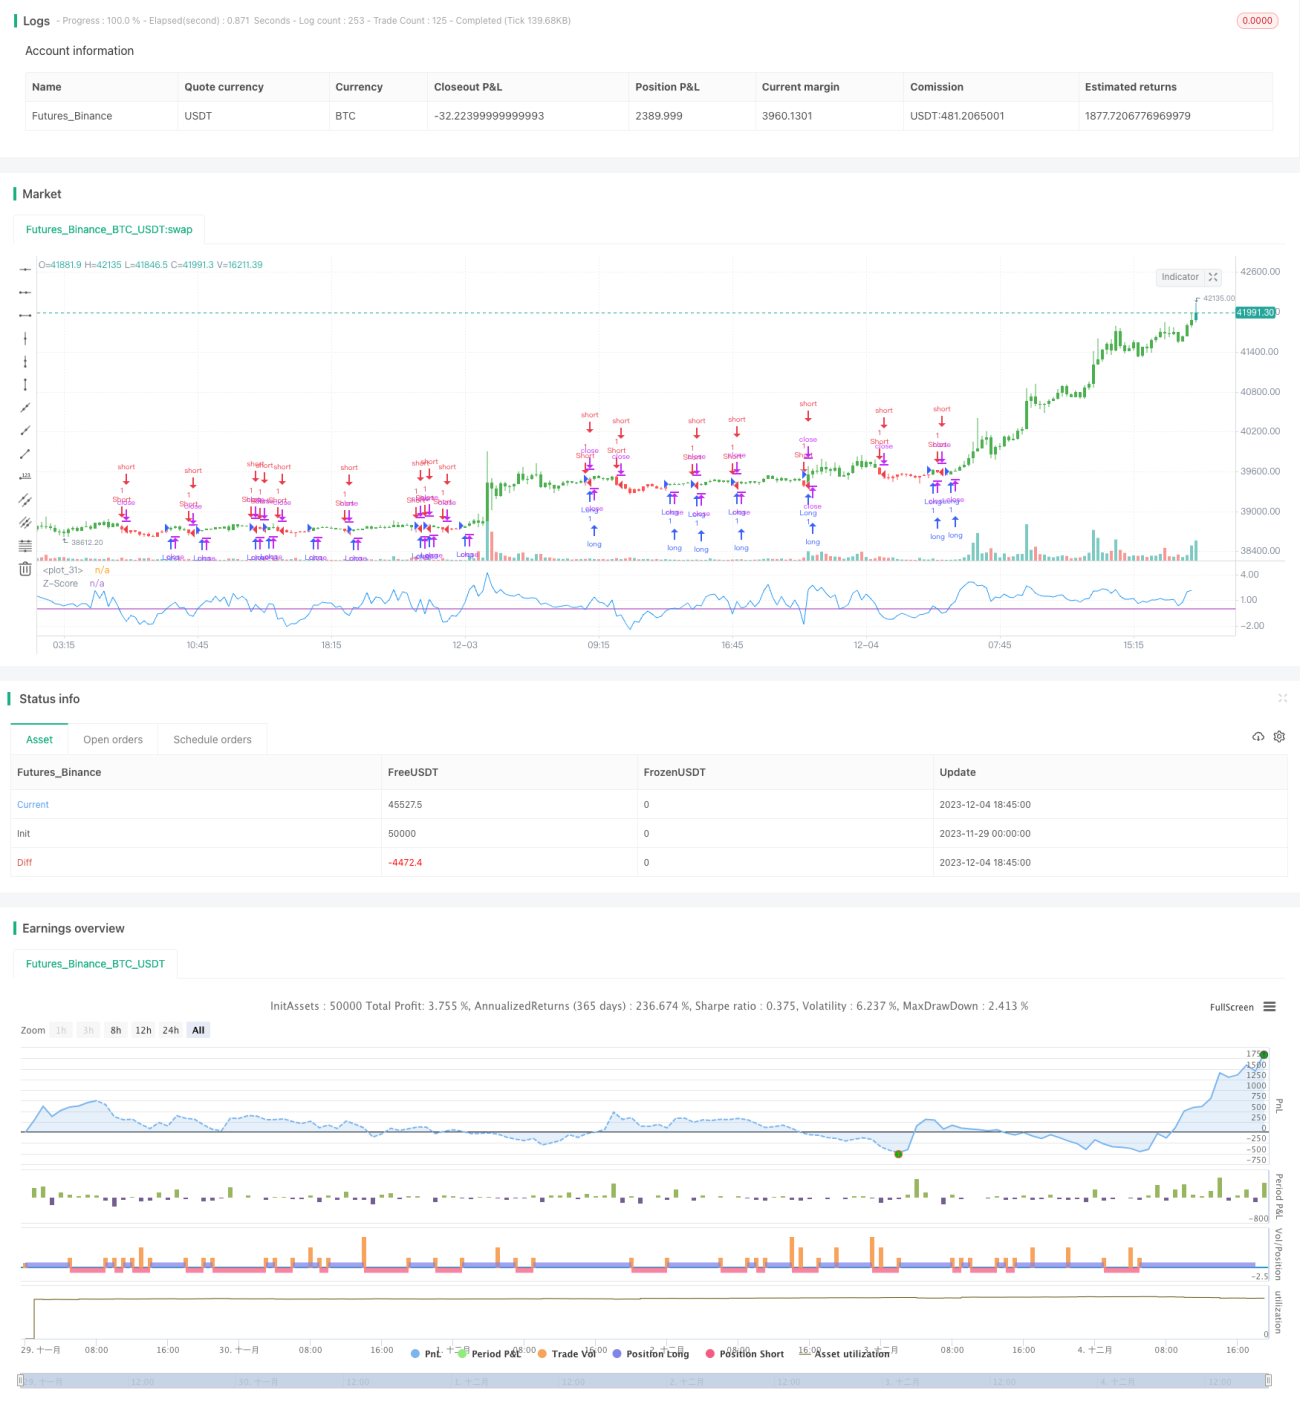
/*backtest
start: 2023-11-29 00:00:00
end: 2023-12-04 19:00:00
period: 15m
basePeriod: 5m
exchanges: [{"eid":"Futures_Binance","currency":"BTC_USDT"}]
*/

//@version=2
////////////////////////////////////////////////////////////
//  Copyright by HPotter v1.0 18/01/2017
// The author of this indicator is Veronique Valcu. The z-score (z) for a data - 1