
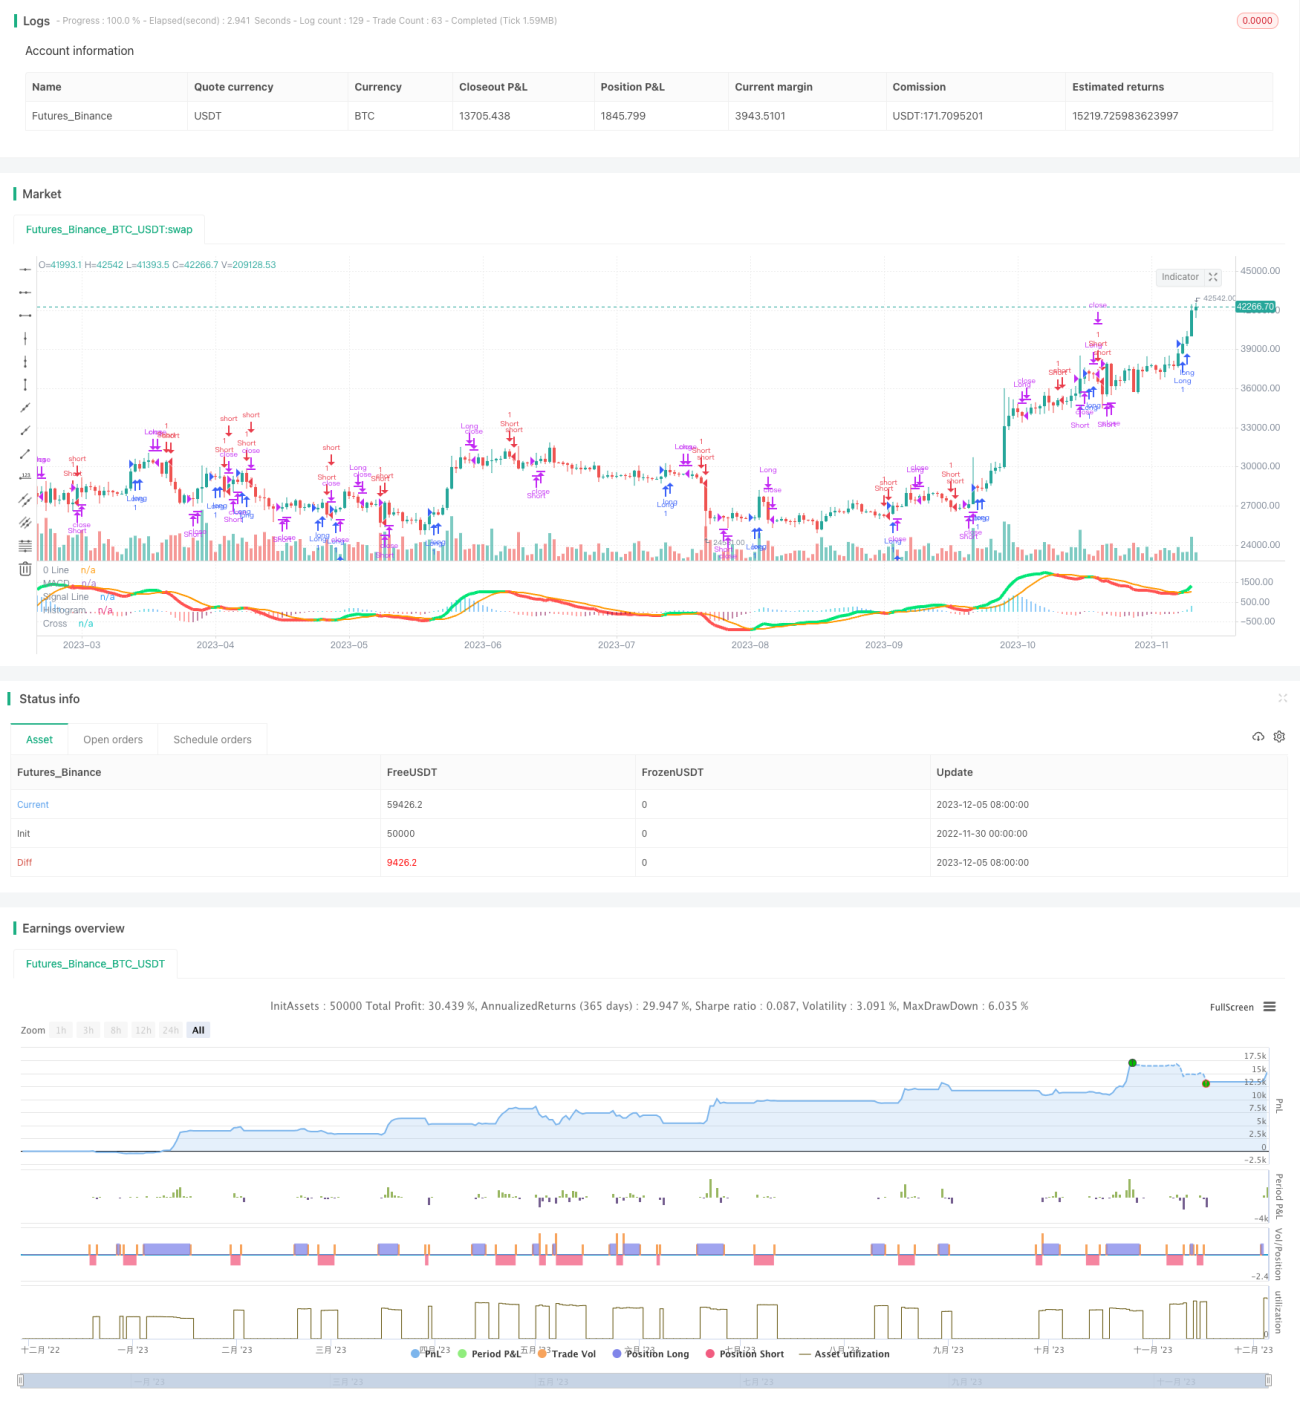
La estrategia se basa en el MACD para implementar una estrategia de negociación bidireccional. Se puede hacer un alza y baja en el MACD cuando hay un tenedor y un tenedor muertos, y se puede combinar con otros indicadores para filtrar algunas señales.
La estrategia utiliza principalmente el indicador MACD para realizar operaciones bidireccionales. En concreto, calcula las medias móviles rápidas, las medias móviles lentas y las líneas de señal MACD. Se genera una señal de golden fork cuando se atraviesa una media móvil lenta por encima de una media móvil rápida y se genera una señal de dead fork cuando se atraviesa una media móvil lenta por debajo de una media móvil rápida.
Para filtrar algunas señales no válidas, la estrategia también establece un rango de ± 30 como filtro, que solo se activa cuando la columna MACD excede este rango. Además, la dirección de la columna MACD se determina en la posición de equilibrio, y la posición de equilibrio solo ocurre cuando la dirección de dos columnas consecutivas cambia.
En general, esta estrategia es una estrategia de negociación bidireccional básicamente útil. Utiliza las ventajas de los indicadores MACD y, al mismo tiempo, agrega un cierto filtro para controlar la calidad de la señal. Sin embargo, los indicadores MACD en sí mismos también tienen algunos problemas, y aún se necesitan más pruebas y optimizaciones en el mercado real para que la estrategia sea más confiable. En general, esta estrategia sentó las bases de la estrategia de negociación bidireccional, que se puede optimizar continuamente sobre esta base, lo que la convierte en una fuerte estrategia de negociación cuantitativa.
]
/*backtest
start: 2022-11-30 00:00:00
end: 2023-12-06 00:00:00
period: 1d
basePeriod: 1h
exchanges: [{"eid":"Futures_Binance","currency":"BTC_USDT"}]
*/
//@version=3
//Created by user ChrisMoody updated 4-10-2014
//Regular MACD Indicator with Histogram that plots 4 Colors Based on Direction Above and Below the Zero Line
//Update allows Check Box Options, Show MacD & Signal Line, Show Change In color of MacD Line based on cross of Signal Line.
//Show Dots at Cross of MacD and Signal Line, Histogram can show 4 colors or 1, Turn on and off Histogram.
//Special Thanks to that incredible person in Tech Support whoem I won't say you r name so you don't get bombarded with emails
//Note the feature Tech Support showed me on how to set the default timeframe of the indicator to the chart Timeframe, but also allow you to choose a different timeframe.
//By the way I fully disclose that I completely STOLE the Dots at the MAcd Cross from "TheLark"
strategy("MACD Strategy", overlay=false)
// study(title="CM_MacD_Ult_MTF", shorttitle="CM_Ult_MacD_MTF")
source = close
useCurrentRes = input(true, title="Use Current Chart Resolution?")
resCustom = input(title="Use Different Timeframe? Uncheck Box Above", defval="60")
smd = input(true, title="Show MacD & Signal Line? Also Turn Off Dots Below")
sd = input(true, title="Show Dots When MacD Crosses Signal Line?")
sh = input(true, title="Show Histogram?")
macd_colorChange = input(true,title="Change MacD Line Color-Signal Line Cross?")
hist_colorChange = input(true,title="MacD Histogram 4 Colors?")
res = useCurrentRes ? timeframe.period : resCustom
fastLength = input(12, minval=1), slowLength=input(26,minval=1)
signalLength=input(9,minval=1)
fastMA = ema(source, fastLength)
slowMA = ema(source, slowLength)
macd = fastMA - slowMA
signal = sma(macd, signalLength)
hist = macd - signal
outMacD = request.security(syminfo.tickerid, res, macd)
outSignal = request.security(syminfo.tickerid, res, signal)
outHist = request.security(syminfo.tickerid, res, hist)
histA_IsUp = outHist > outHist[1] and outHist > 0
histA_IsDown = outHist < outHist[1] and outHist > 0
histB_IsDown = outHist < outHist[1] and outHist <= 0
histB_IsUp = outHist > outHist[1] and outHist <= 0
//MacD Color Definitions
macd_IsAbove = outMacD >= outSignal
macd_IsBelow = outMacD < outSignal
// strategy.entry("Long", strategy.long, 1, when = shouldPlaceLong)
// strategy.close("Long", shouldExitLong)
// strategy.entry("Short", strategy.short, 1, when = shouldPlaceShort)
// strategy.close("Short", shouldExitShort)
isWithinZeroMacd = outHist < 30 and outHist > -30
delta = hist
// shouldExitShort = false//crossover(delta, 0)
// shouldExitLong = false//crossunder(delta, 0)
// if(crossover(delta, 0))// and not isWithinZeroMacd)
// strategy.entry("Long", strategy.long, comment="Long")
// if (crossunder(delta, 0))// and not isWithinZeroMacd)
// strategy.entry("Short", strategy.short, comment="Short")
shouldPlaceLong = crossover(delta, 0)
strategy.entry("Long", strategy.long, 1, when = shouldPlaceLong)
shouldExitLong = not histA_IsUp and histA_IsDown
shouldExitShort = not histA_IsUp and not histA_IsDown and not histB_IsDown and histB_IsUp
shouldPlaceShort = crossunder(delta, 0)
strategy.entry("Short", strategy.short, 1, when = shouldPlaceShort)
// plot_color = gray
plot_color = if(hist_colorChange)
if(histA_IsUp)
aqua
else
if(histA_IsDown)
//need to sell
// if(not isWithinZeroMacd)
// shouldExitLong = true
// strategy.entry("Short", strategy.short, comment="Short")
blue
else
if(histB_IsDown)
red
else
if(histB_IsUp)
//need to buy
// if(not isWithinZeroMacd)
// shouldExitShort = true
// strategy.entry("Long", strategy.long, comment="Long")
maroon
else
yellow
else
gray
// plot_color = hist_colorChange ? histA_IsUp ? aqua : histA_IsDown ? blue : histB_IsDown ? red : histB_IsUp ? maroon :yellow :gray
macd_color = macd_colorChange ? macd_IsAbove ? lime : red : red
signal_color = macd_colorChange ? macd_IsAbove ? orange : orange : lime
circleYPosition = outSignal
plot(smd and outMacD ? outMacD : na, title="MACD", color=macd_color, linewidth=4)
plot(smd and outSignal ? outSignal : na, title="Signal Line", color=signal_color, style=line ,linewidth=2)
plot(sh and outHist ? outHist : na, title="Histogram", color=plot_color, style=histogram, linewidth=4)
plot(sd and cross(outMacD, outSignal) ? circleYPosition : na, title="Cross", style=circles, linewidth=4, color=macd_color)
// plot( isWithinZeroMacd ? outHist : na, title="CheckSmallHistBars", style=circles, linewidth=4, color=black)
hline(0, '0 Line', linewidth=2, color=white)
strategy.close("Short", shouldExitShort)
strategy.close("Long", shouldExitLong)
// fastLength = input(12)
// slowlength = input(26)
// MACDLength = input(9)
// MACD = ema(close, fastLength) - ema(close, slowlength)
// aMACD = ema(MACD, MACDLength)
// delta = MACD - aMACD
// if (crossover(delta, 0))
// strategy.entry("MacdLE", strategy.long, comment="MacdLE")
//if last two macd bars are higher than current, close long position
// if (crossunder(delta, 0))
// strategy.entry("MacdSE", strategy.short, comment="MacdSE")
//if last two macd bars are higher than current, close long position
// plot(strategy.equity, title="equity", color=red, linewidth=2, style=areabr)