Estrategia de rebote de media móvil

Descripción general de la estrategia
La estrategia de rebote de la media móvil es una estrategia que sigue a los precios para romper las medias móviles. Se examina si el tiburón se rebota por debajo de la media móvil, y si lo hace, es una señal de cabeza; si el tiburón se rebota por encima de la media móvil, es una señal de cabeza.
Nombre de la estrategia
Exponential Moving Average Bounce Strategy
Principio de estrategia
La estrategia se basa en el promedio móvil exponencial. Se calcula una línea EMA en tiempo real. Luego se comprueba si el precio rebota por encima o por debajo de la línea EMA:
- Si el precio cae por encima de la línea EMA y luego retoma el recorrido por encima de la línea EMA, es una señal de múltiples cabezas.
- Una señal de cabeza hueca se produce si el precio rompe la línea EMA y luego vuelve a caer para cerrar por debajo de la línea EMA
La respuesta es la señal de entrada en la estrategia.
Análisis de las ventajas estratégicas
El funcionamiento de flujo, evitar ser atrapados
La estrategia de rebote de la EMA sólo se utiliza cuando se determina una reversión de los precios, lo que evita que la operación de rebote se bloquee.
Retiradas pequeñas, ganancias históricas
Debido a la utilización de las medias móviles de índices, que permiten suavizar eficazmente los datos de precios y filtrar el ruido del mercado, el retroceso de la estrategia es pequeño y los rendimientos históricos son mejores.
Es fácil de entender, los parámetros se ajustan con flexibilidad
La estrategia de rebote de EMA depende únicamente de las medias móviles, es muy simple y directa, fácil de entender para los novatos; al mismo tiempo, los parámetros de los períodos de EMA se pueden ajustar de manera flexible para adaptarse a diferentes variedades.
Análisis de riesgos
Es fácil falsas señales
A menudo hay falsas rupturas densas cerca de la línea EMA, que pueden provocar señales erróneas. Se requiere ajustar los parámetros EMA para filtrar estos ruidos.
La operación de fluctuación no puede predecir el punto de inflexión.
La estrategia es esencialmente una operación de avance. No se puede predecir el punto de inflexión de los precios, solo se puede perseguir la tendencia.
La posición de deterioro es fácil de romper.
Los puntos de parada cercanos a la media móvil a veces se superan, lo que genera pérdidas ampliadas. Esto requiere el uso de un método de parada más flexible.
Dirección de optimización
Combinación con otros indicadores para filtrar señales
Se pueden agregar otros indicadores como el RSI, el MACD y otros para confirmar la inversión de precios y filtrar las falsas señales.
Optimización de la pérdida
Se pueden utilizar métodos de deterioro más flexibles, como el tiempo de detención y el deterioro por vibración, para reducir el riesgo de ser derribado.
Optimización de parámetros
Optimización de los parámetros del ciclo EMA para encontrar la combinación óptima de parámetros. También se puede hacer que los parámetros EMA cambien dinámicamente para seguir el ciclo del mercado.
Resumir
La estrategia de rebote de la media móvil es una estrategia de seguimiento de tendencias sencilla y práctica. Se opera de forma progresiva, tiene pequeñas retrocesos y es fácil de entender. Al mismo tiempo, existe un cierto riesgo de falsas señales y riesgo de parada. Se puede optimizar la estrategia para que sea una estrategia cuantitativa estable y confiable a través de una mejor combinación de indicadores, métodos de parada y opciones de parámetros.
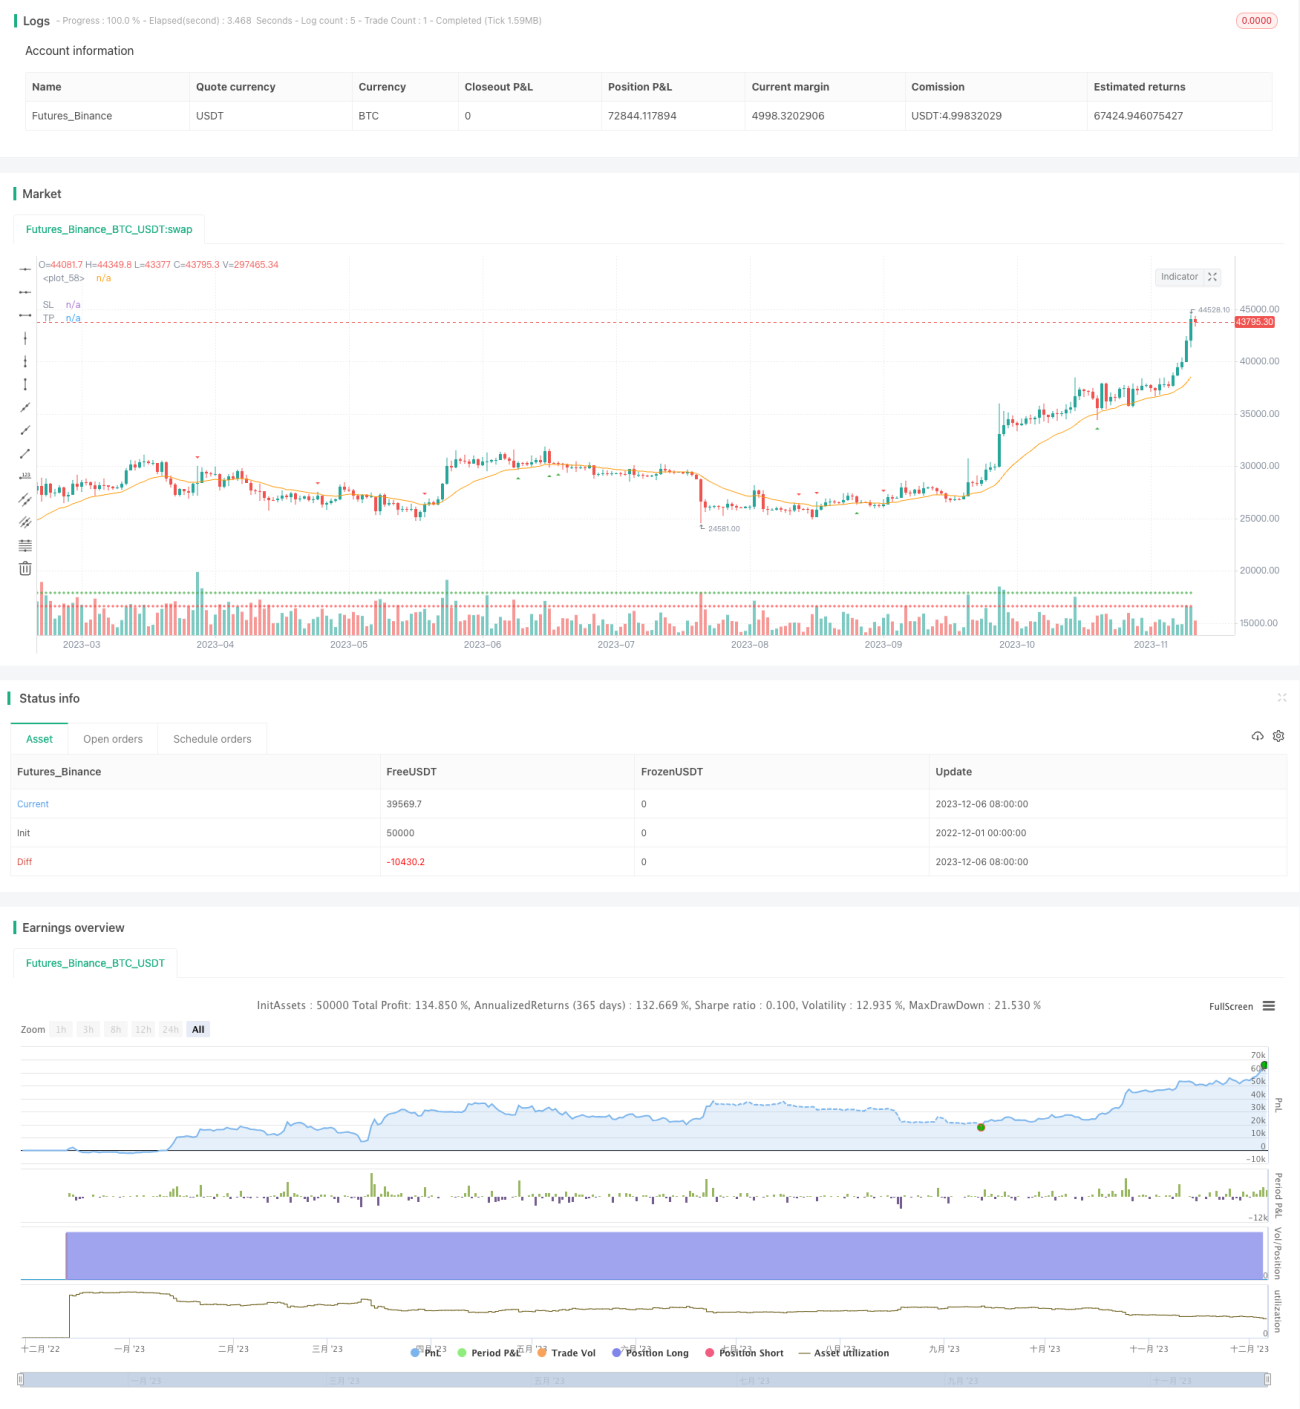
/*backtest
start: 2022-12-01 00:00:00
end: 2023-12-07 00:00:00
period: 1d
basePeriod: 1h
exchanges: [{"eid":"Futures_Binance","currency":"BTC_USDT"}]
*/

// This source code is subject to the terms of the Mozilla Public License 2.0 at https://mozilla.org/MPL/2.0/
// © tweakerID

// Simple strategy that checks for price bounces over an Exponential Moving Average. If the CLOSE of the candle bounces- 1