Estrategia de seguimiento de tendencias con toma de ganancias y stop loss dinámico
Descripción general
La estrategia de seguimiento de tendencia de stop-loss es una estrategia de comercio cuantitativa que combina el seguimiento de tendencia, la parada parcial y la parada de seguimiento completo, con el objetivo de capturar la tendencia al alza de los precios en un mercado alcista y obtener ganancias con un método de parada inteligente, mientras que utiliza el seguimiento de la parada para controlar el riesgo a la baja.
Principio de estrategia
La estrategia utiliza como señal de compra una media móvil rápida y un forquillo de media móvil lenta. Cuando una media móvil rápida atraviesa una media móvil lenta, indica que se forma una tendencia al alza de los precios, y la estrategia abre más posiciones.
Luego, la estrategia establece un precio de parada, que es igual al precio de apertura multiplicado por el porcentaje de parada establecido. Cuando el precio alcanza ese precio de parada, la estrategia se cerrará parcialmente y venderá el 50% de la posición por defecto. Esto logra una parada parcial y bloquea parte de las ganancias.
A continuación, la estrategia también activa el mecanismo de seguimiento de la tendencia de los paros. Cuando el precio continúa subiendo, el precio de los paros seguirá el precio en la proporción de pasos establecidos trailingTakeProfitDeviationPerc. Esto permite que los precios de los paros sigan la tendencia de los precios al alza y logren paros de seguimiento de tendencias.
Al mismo tiempo, la estrategia también inicia un seguimiento de stop loss. Una vez que el precio alcanza el precio de parada, el precio de parada comienza a moverse hacia arriba. El seguimiento siempre se mantiene en el nivel del punto más alto multiplicado por el porcentaje de caída de la parada.
Cuando se produce una reorientación del precio, si se rompe el seguimiento del precio de parada, la estrategia se detiene y se dirige a la posición de mercado para cerrar todas las posiciones restantes. Hasta entonces, el ciclo de negociación completo.
Análisis de las ventajas
La estrategia integra varias funciones, como seguimiento de tendencias, paradas parciales y seguimiento de pérdidas en todo el recorrido, con las siguientes ventajas:
- El precio de las acciones en el mercado de divisas es más alto que el precio de las acciones en el mercado de divisas, lo que significa que el precio de las acciones en el mercado de divisas es más alto.
- El mecanismo de suspensión parcial permite bloquear parte de los beneficios y evitar la recaudación total de los mismos.
- El mecanismo de seguimiento de la tendencia permite que los precios de los estancadores se ajusten a la subida de los precios.
- El bloqueo de pérdidas se activa para bloquear más ganancias y controlar el riesgo a la baja.
- Los parámetros de la estrategia se pueden configurar y ajustar a su nivel de riesgo aceptable.
Análisis de riesgos
La estrategia también presenta ciertos riesgos, que se manifiestan principalmente en los siguientes aspectos:
- La compra puede ocasionar una fuerte caída en el precio, la imposibilidad de detener o detener la pérdida, lo que hace que las pérdidas se amplíen;
- El precio de la parada no puede ser seguido a tiempo al final de la tendencia y puede haber perdido el mejor punto de parada.
- El precio de parada está demasiado alto y la caída de los precios provoca una pérdida excesiva.
- La frecuencia de las transacciones puede ser demasiado alta, y los costos de las transacciones y las pérdidas de puntos de deslizamiento son más altos.
En consecuencia, se puede optimizar y mejorar en los siguientes aspectos:
- Establecer los parámetros de las medias móviles de manera razonable para evitar señales erróneas;
- Reducir adecuadamente el porcentaje de estancamiento para reducir el riesgo;
- Aumentar el margen de amortización de pérdidas y controlar las pérdidas individuales.
- Ajuste los parámetros de la proporción de paso para optimizar el seguimiento de la parada.
Dirección de optimización
La estrategia tiene espacio para ser optimizada aún más:
- En la actualidad, la mayoría de los países de la Unión Europea tienen un sistema de medición de la pobreza, que se basa en el uso de la tecnología de la información.
- La introducción de un módulo de gestión de posiciones para un tamaño de posición más razonable;
- El aumento del mecanismo de ajuste dinámico de stop loss para que los parámetros sean más automáticos;
- Se ha añadido un mecanismo de filtración para evitar el comercio equivocado de variedades de alta energía.
Estas optimizaciones pueden hacer que las estrategias sean más estables, más eficientes y mejoren el rendimiento.
Resumir
La estrategia de seguimiento de la tendencia de seguimiento de la parada de seguimiento de la parada de pérdidas utiliza un conjunto de técnicas como el seguimiento de la tendencia, la parada inteligente y el seguimiento de la parada de todo el proceso, en base a la captura de la tendencia de aumento de precios, también se logra el seguimiento de la tendencia de los precios de la parada y el movimiento del nivel de pérdidas de seguimiento. Esto permite que la estrategia funcione con la tendencia y obtenga más ganancias en el mercado alcista.
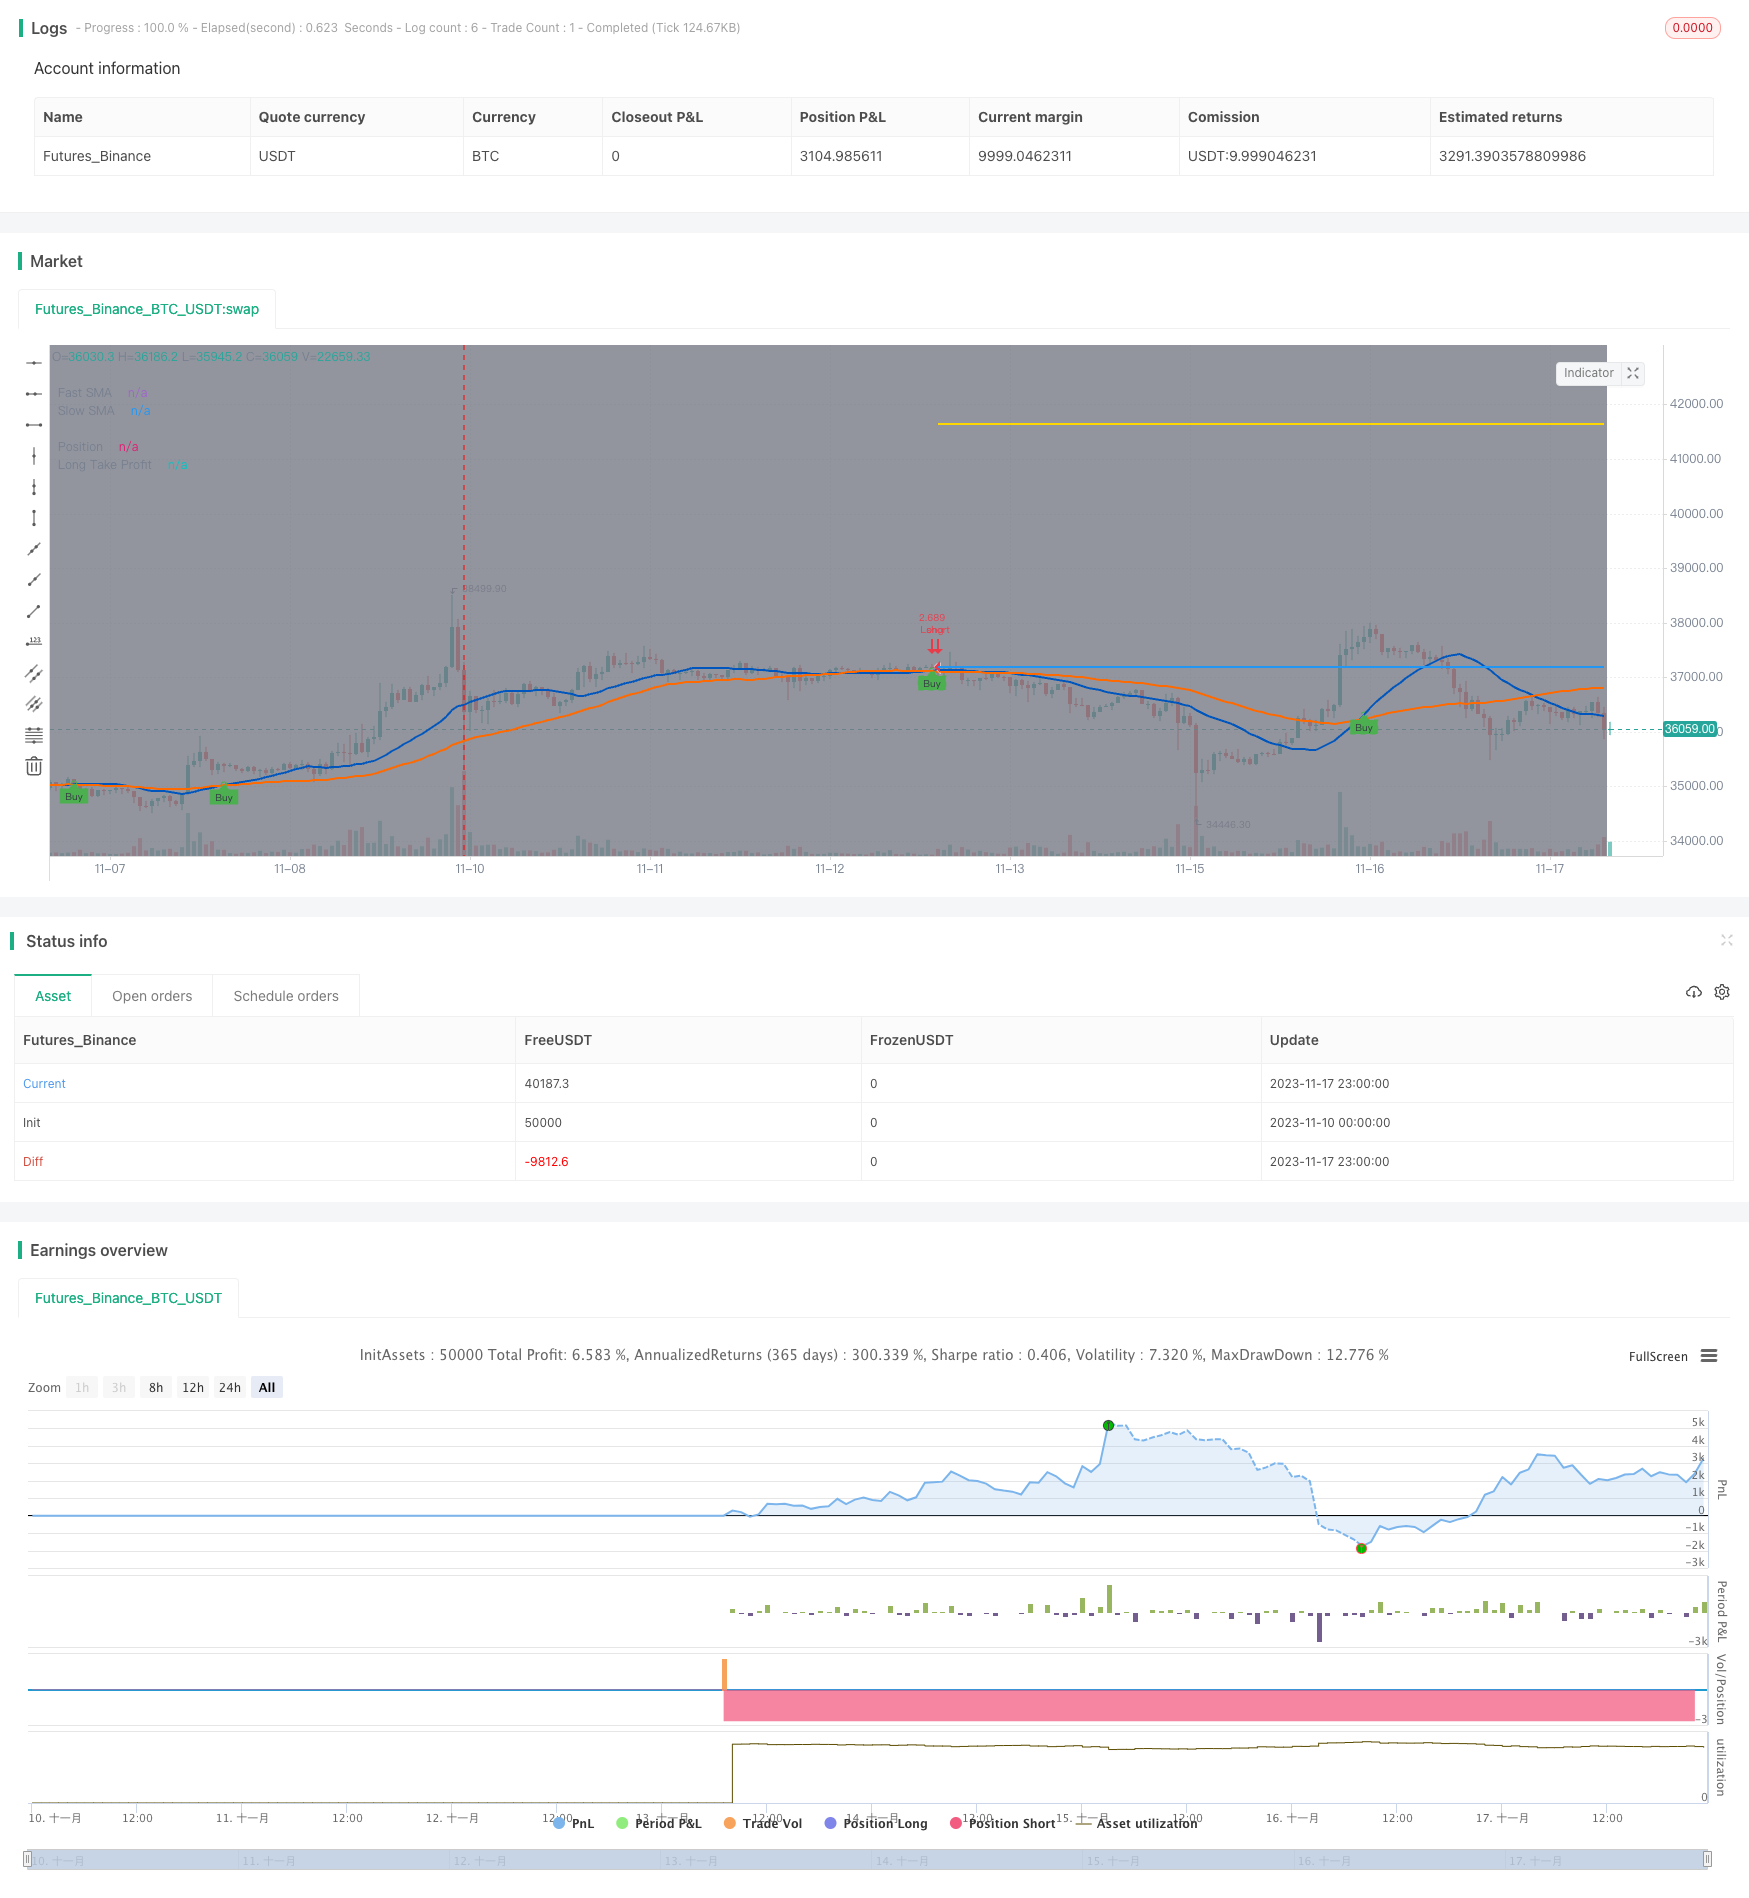
/*backtest
start: 2023-11-10 00:00:00
end: 2023-11-18 00:00:00
period: 1h
basePeriod: 15m
exchanges: [{"eid":"Futures_Binance","currency":"BTC_USDT"}]
*/

//@version=4
//
// ▒▒▒▒▒▒▒▒▒▒▒▒▒▒▒▒▒▒▒▒▒▒▒▒▒▒▒▒▒▒▒▒▒▒▒▒▒▒▒▒▒▒▒▒▒▒▒▒▒▒▒▒▒▒▒▒▒▒▒▒▒▒▒▒▒▒▒▒▒▒▒▒▒▒▒▒▒▒▒▒▒▒▒▒▒▒▒▒▒▒▒▒▒▒▒▒▒▒▒▒▒▒▒▒▒▒▒▒▒▒▒▒▒▒
//  -----------------------------------------------------------------------------
//  Copyright 2021 Iason Nikolas | jason5480
//  Trainiling Take Profit Trailing Stop Loss script may be freely distributed under the MIT license.
//
//  Permission is hereby granted, free of charge,
//  to any person obtaining a copy of this software and associated documentation files (the "Software"),
//  to deal in the Software without restriction, including without limitation the rights to use, copy, modify, merge,
//  publish, distribute, sublicense, and/or sell copies of the Software, and to permit persons to whom the Software is furnished to do so,
//  subject to the following conditions:
//
//  The above copyright notice and this permission notice shall be included in all copies or substantial portions of the Software.
//
//  THE SOFTWARE IS PROVIDED "AS IS", WITHOUT WARRANTY OF ANY KIND,
//  EXPRESS OR IMPLIED, INCLUDING BUT NOT LIMITED TO THE WARRANTIES OF MERCHANTABILITY,
//  FITNESS FOR A PARTICULAR PURPOSE AND NONINFRINGEMENT. IN NO EVENT SHALL THE AUTHORS OR COPYRIGHT HOLDERS BE LIABLE FOR ANY CLAIM,
//  DAMAGES OR OTHER LIABILITY, WHETHER IN AN ACTION OF CONTRACT, TORT OR OTHERWISE, ARISING FROM,
//  OUT OF OR IN CONNECTION WITH THE SOFTWARE OR THE USE OR OTHER DEALINGS IN THE SOFTWARE.
//
//  -----------------------------------------------------------------------------
//
//  Authors:  @jason5480
//  Revision: v1.0.1
//  Date:     18-Apr-2021
//
//  Description
//  =============================================================================
//  This strategy will go long if fast MA crosses over slow MA.
//  The strategy will exit from long position when the price increases by a fixed percentage.
//  If the trailing take profit is checked then the strategy instead of setting a limit order in a predefined price (based on the percentage)
//  it will follow the price with small steps (percentagewise)
//  If the price drops by this percentage then the exit order will be executed
//
//  The strategy has the following parameters:
//
//  Fast SMA Length - How many candles back to calculte the fast SMA.
//  Slow SMA Length - How many candles back to calculte the slow SMA.
//  Take Profit % - The percentage of the price increase to set the take profit price target.
//  Enable Trailing - Enable or disable the trailing for take profit.
//  Training Take Profit Deviation % - The step to follow the price when the take profit limit is reached.
//  Trailing Stop Loss % - The stop loss percentage drop that will close your position. After the take profit price is reached the trailing stop loss price target will follow the price upwards (for long positions).
//
//  -----------------------------------------------------------------------------
//  Disclaimer:
//    1. I am not licensed financial advisors or broker dealer. I do not tell you
//       when or what to buy or sell. I developed this software which enables you
//       execute manual or automated trades using TradingView. The
//       software allows you to set the criteria you want for entering and exiting
//       trades.
//    2. Do not trade with money you cannot afford to lose.
//    3. I do not guarantee consistent profits or that anyone can make money with no
//       effort. And I am not selling the holy grail.
//    4. Every system can have winning and losing streaks.
//    5. Money management plays a large role in the results of your trading. For
//       example: lot size, account size, broker leverage, and broker margin call
//       rules all have an effect on results. Also, your Take Profit and Stop Loss
//       settings for individual pair trades and for overall account equity have a
//       major impact on results. If you are new to trading and do not understand
//       these items, then I recommend you seek education materials to further your
//       knowledge.
//
//    YOU NEED TO FIND AND USE THE TRADING SYSTEM THAT WORKS BEST FOR YOU AND YOUR
//    TRADING TOLERANCE.
//
//    I HAVE PROVIDED NOTHING MORE THAN A TOOL WITH OPTIONS FOR YOU TO TRADE WITH THIS PROGRAM ON TRADINGVIEW.
//
//    I accept suggestions to improve the script.
//    If you encounter any problems I will be happy to share with me.
//  -----------------------------------------------------------------------------
//
// ▒▒▒▒▒▒▒▒▒▒▒▒▒▒▒▒▒▒▒▒▒▒▒▒▒▒▒▒▒▒▒▒▒▒▒▒▒▒▒▒▒▒▒▒▒▒▒▒▒▒▒▒▒▒▒▒▒▒▒▒▒▒▒▒▒▒▒▒▒▒▒▒▒▒▒▒▒▒▒▒▒▒▒▒▒▒▒▒▒▒▒▒▒▒▒▒▒▒▒▒▒▒▒▒▒▒▒▒▒▒▒▒▒▒
// SETUP ============================================================================================================
strategy(title = "Trailing Take Profit Trailing Stop Loss",
         shorttitle = "TTPTSL",
         overlay = true,
         pyramiding = 0,
         default_qty_type = strategy.cash,
         default_qty_value = 100000,
         initial_capital = 100000)

//
// ▒▒▒▒▒▒▒▒▒▒▒▒▒▒▒▒▒▒▒▒▒▒▒▒▒▒▒▒▒▒▒▒▒▒▒▒▒▒▒▒▒▒▒▒▒▒▒▒▒▒▒▒▒▒▒▒▒▒▒▒▒▒▒▒▒▒▒▒▒▒▒▒▒▒▒▒▒▒▒▒▒▒▒▒▒▒▒▒▒▒▒▒▒▒▒▒▒▒▒▒▒▒▒▒▒▒▒▒▒▒▒▒▒▒
// INPUTS ===========================================================================================================

// STRATEGY INPUT ===================================================================================================
fastMALen = input(defval = 21, title = "Fast SMA Length", type = input.integer, group = "Strategy", tooltip = "How many candles back to calculte the fast SMA.")
slowMALen = input(defval = 49, title = "Slow SMA Length", type = input.integer, group = "Strategy", tooltip = "How many candles back to calculte the slow SMA.")

longTakeProfitPerc = input(defval = 12.0, title = 'Take Profit %', type = input.float, step = 0.1, group = "Strategy", tooltip = "The percentage of the price increase to set the take profit price target.") / 100
profitQuantityPerc = input(defval = 50, title = 'Take Profit Quantity %', type = input.float, step = 1.0, group = "Strategy", tooltip = "The percentage of the position that will be withdrawn when the take profit price target is hit.") / 100

enableTrailing = input(defval = true, title = "Enable Trailing", type = input.bool, group = "Strategy", tooltip = "Enable or disable the trailing for take profit.")
trailingTakeProfitDeviationPerc = input(defval = 1.0, title = 'Trailing Take Profit Deviation %', type = input.float, step = 0.05, group = "Strategy", tooltip = "The step to follow the price when the take profit limit is reached.") / 100

longTrailingStopLossPerc  = input(defval = 7.5, title = 'Trailing Stop Loss %',  type = input.float, step = 0.1, group = "Strategy", tooltip = "The stop loss percentage drop that will close your position. After the take profit price is reached the trailing stop loss price target will follow the price upwards (for long positions).") / 100

// BACKTEST PERIOD INPUT ============================================================================================
fromDate = input(defval = timestamp("01 Jan 2021 00:00 UTC"), title = "From Date", type = input.time, minval = timestamp("01 Jan 1970 00:00 UTC"), group = "Backtest Period") // backtest start date
toDate   = input(defval = timestamp("31 Dec 2121 23:59 UTC"), title = "To Date",   type = input.time, minval = timestamp("01 Jan 1970 00:00 UTC"), group = "Backtest Period") // backtest finish date

isWithinBacktestPeriod() => true // create function "within window of time"

// SHOW PLOT INPUT ==================================================================================================
showDate = input(defval = true, title = "Show Backtest Range", type = input.bool, group = "Plot", tooltip = "Gray out the backround of the backtest period.")

//
// ▒▒▒▒▒▒▒▒▒▒▒▒▒▒▒▒▒▒▒▒▒▒▒▒▒▒▒▒▒▒▒▒▒▒▒▒▒▒▒▒▒▒▒▒▒▒▒▒▒▒▒▒▒▒▒▒▒▒▒▒▒▒▒▒▒▒▒▒▒▒▒▒▒▒▒▒▒▒▒▒▒▒▒▒▒▒▒▒▒▒▒▒▒▒▒▒▒▒▒▒▒▒▒▒▒▒▒▒▒▒▒▒▒▒
// STRATEGY =========================================================================================================

fastMA = sma(close, fastMALen)
slowMA = sma(close, slowMALen)

startLongDeal = crossover(fastMA, slowMA)

longTakeProfitPrice = strategy.position_avg_price * (1 + longTakeProfitPerc)

longTrailingTakeProfitStepTicks = longTakeProfitPrice * trailingTakeProfitDeviationPerc / syminfo.mintick

// determine trailing stop loss price. Trailing starts when the take profit price is reached
longTrailingStarted = false
longTrailingStarted := if (strategy.position_size > 0)
    crossover(high, longTakeProfitPrice) or (high[1] >= longTakeProfitPrice) or longTrailingStarted[1]
else
    false

float longTrailingStopLossPrice = na
longTrailingStopLossPrice := if (strategy.position_size > 0)
    stopValue = longTrailingStarted == true ? high * (1 - longTrailingStopLossPerc) : strategy.position_avg_price * (1 - longTrailingStopLossPerc)
    max(stopValue, nz(longTrailingStopLossPrice[1]))
else
    na

//
// ▒▒▒▒▒▒▒▒▒▒▒▒▒▒▒▒▒▒▒▒▒▒▒▒▒▒▒▒▒▒▒▒▒▒▒▒▒▒▒▒▒▒▒▒▒▒▒▒▒▒▒▒▒▒▒▒▒▒▒▒▒▒▒▒▒▒▒▒▒▒▒▒▒▒▒▒▒▒▒▒▒▒▒▒▒▒▒▒▒▒▒▒▒▒▒▒▒▒▒▒▒▒▒▒▒▒▒▒▒▒▒▒▒▒
// STRATEGY EXECUTION ===============================================================================================

if (isWithinBacktestPeriod())
    // getting into LONG position
    strategy.entry(id = "Long", long = strategy.long, when = startLongDeal, comment = "Long", alert_message = "Long("  + syminfo.ticker + "): Started")
    if (strategy.position_size > 0)
        strategy.exit(id = "TTP", from_entry = "Long", qty = profitQuantityPerc * strategy.position_size, limit = enableTrailing ? na : longTakeProfitPrice, trail_price = enableTrailing ? longTakeProfitPrice : na, trail_offset = enableTrailing ? longTrailingTakeProfitStepTicks : na, oca_name = 'Exit Long', comment = "Long Take Profit", alert_message = "Long(" + syminfo.ticker + "): Trailing Take Profit activated")
        strategy.order(id = "TSL", long = strategy.short, qty = strategy.position_size, stop = longTrailingStopLossPrice, oca_name = 'Exit Long', oca_type = strategy.oca.cancel, comment = "Stop/Trail", when = true, alert_message = "Long("  + syminfo.ticker + "): Trailing Stop Loss activated")
    else
        strategy.cancel(id = "TTP", when = true)
        strategy.cancel(id = "TSL", when = true)

//
// ▒▒▒▒▒▒▒▒▒▒▒▒▒▒▒▒▒▒▒▒▒▒▒▒▒▒▒▒▒▒▒▒▒▒▒▒▒▒▒▒▒▒▒▒▒▒▒▒▒▒▒▒▒▒▒▒▒▒▒▒▒▒▒▒▒▒▒▒▒▒▒▒▒▒▒▒▒▒▒▒▒▒▒▒▒▒▒▒▒▒▒▒▒▒▒▒▒▒▒▒▒▒▒▒▒▒▒▒▒▒▒▒▒▒
// PLOT DATE POSITION MA AND TRAILING TAKE PROFIT STOP LOSS =========================================================

bgcolor(color = showDate and isWithinBacktestPeriod() ? color.gray : na, transp = 90)

plot(series = fastMA, color = #0056BD, style = plot.style_line, linewidth = 2, title = "Fast SMA")
plot(series = slowMA, color = #FF6A00, style = plot.style_line, linewidth = 2, title = "Slow SMA")
plotshape(series = isWithinBacktestPeriod() and startLongDeal and strategy.position_size <= 0 ? fastMA : na, title = "UpTrend Begins", location = location.absolute, style = shape.circle, size = size.tiny, color = color.green, transp = 0)
plotshape(series = isWithinBacktestPeriod() and startLongDeal and strategy.position_size <= 0 ? fastMA : na, title = "Buy", text = "Buy", location = location.absolute, style = shape.labelup, size = size.tiny, color = color.green, textcolor = color.black, transp = 0)

plot(series = strategy.position_avg_price, color = color.blue, style = plot.style_linebr, linewidth = 2, title = "Position")
plot(series = longTakeProfitPrice, color = #FFD700, style = plot.style_linebr, linewidth = 2, title = "Long Take Profit")
plot(series = longTrailingStopLossPrice, color = color.fuchsia, style = plot.style_linebr, linewidth = 2, title = "Long Trail Stop")

// ==================================================================================================================