Estrategias alcistas y bajistas basadas en canales de fluctuación interna de precios

Descripción general
La estrategia utiliza el canal interno del precio para determinar el movimiento futuro del precio y es una estrategia de seguimiento de tendencias. Cuando el precio forma una cierta cantidad de canal interno de fluctuación del precio, se considera una señal de cambio de tendencia y se realiza una operación de compra o venta.
Principio de estrategia
Esta estrategia determina la formación de un canal interno en función de la relación entre el precio máximo y el precio mínimo de las dos líneas K anteriores y posteriores. Cuando un número determinado de líneas K cumple con la condición de que el precio máximo es inferior al precio máximo de la línea K anterior y el precio mínimo es superior al precio mínimo de la línea K anterior, se determina que el precio es un canal interno.
Al mismo tiempo que determina la formación de un canal interno de precios, la estrategia también determina la dirección de este canal interno. Si es un canal interno bajista, genera una señal de compra; si es un canal interno bajista, genera una señal de venta. Por lo tanto, la estrategia pertenece a una estrategia de negociación bidireccional.
Para filtrar falsas señales, la estrategia también introdujo un indicador de promedio móvil. Sólo se producen señales de negociación reales cuando el precio está por encima o por debajo de la media móvil. Esto puede evitar hasta cierto punto las transacciones erróneas en la liquidación del mercado.
Después de la entrada, la estrategia también establece un punto de parada de pérdidas según la elección del usuario. Se pueden elegir tres tipos de paradas: paradas de puntos fijos, paradas de ATR y paradas de puntos máximos y mínimos previos. La configuración de paradas es una parada del porcentaje de retorno del riesgo. Esto puede bloquear los beneficios y controlar el riesgo hasta cierto punto.
Análisis de las ventajas
La mayor ventaja de esta estrategia reside en su gran capacidad para identificar los puntos de inflexión de tendencias. Cuando los precios forman un cierto número de canales internos, suelen indicar que se avecina una gran caída. Este juicio es altamente compatible con la teoría tradicional del análisis técnico.
Además, la estrategia en sí misma es muy configurable. Los usuarios pueden elegir libremente el número de canales internos, el ciclo de la media móvil, los parámetros de parada de pérdidas, etc. Esto proporciona una gran flexibilidad para diferentes variedades y estilos de negociación.
Finalmente, la estrategia incluye un filtro de media móvil y una configuración de stop loss que reduce considerablemente el riesgo de negociación. Esto hace que la estrategia pueda aplicarse a operaciones en todo tipo de entornos de mercado.
Análisis de riesgos
El mayor riesgo de esta estrategia es la alta probabilidad de error en la determinación de la tendencia. Los canales internos no pueden determinar completamente la reversión de los precios, existe una cierta probabilidad de error. Si la cantidad determinada es insuficiente, puede haber casos de falsas señales.
Además, la estrategia no se aplica en absoluto en un mercado de reajuste o oscilación. Cuando los precios oscilan hacia arriba y hacia abajo, pero no se ha establecido una tendencia, la estrategia generará una serie de señales erróneas. Esto se debe a la mecánica de la estrategia.
Por último, los paros demasiado conservadores también pueden hacer que la estrategia no se mantenga el tiempo suficiente para capturar ganancias en las grandes tendencias. Esto requiere que el usuario se balancee a sí mismo.
Dirección de optimización
La estrategia tiene un amplio margen de optimización. Algunas de las posibles direcciones de optimización incluyen:
-
Optimización de la cantidad y la forma de los canales internos. Se puede probar la eficacia de las transacciones en diferentes cantidades o en diferentes combinaciones de secuencias.
-
Optimización de los parámetros de ciclo de las medias móviles para que sean mejores para juzgar la dirección de las tendencias. El ciclo predeterminado actual puede no ser adecuado para todas las variedades.
-
Añadir otros filtros de indicadores. Por ejemplo, la introducción de bandas de Brin, que generan una señal de negociación solo cuando el precio se rompe en la banda de Brin para subir o bajar de la vía.
-
Optimización de los parámetros de stop loss para que la estrategia pueda mantener posiciones durante un período más prolongado de tiempo y, por lo tanto, capturar ganancias en la supertrend.
En general, la estrategia existe por su precisión en el juicio de la tendencia. La mejor manera de operar con un algoritmo eficaz es asegurando la precisión del juicio, complementado con una configuración adecuada de gestión de riesgos.
Resumir
En general, esta estrategia es una estrategia de negociación cuantitativa para determinar la tendencia futura de los precios en función de los canales internos de los precios. Combina el seguimiento de la tendencia y la inversión de la tendencia.
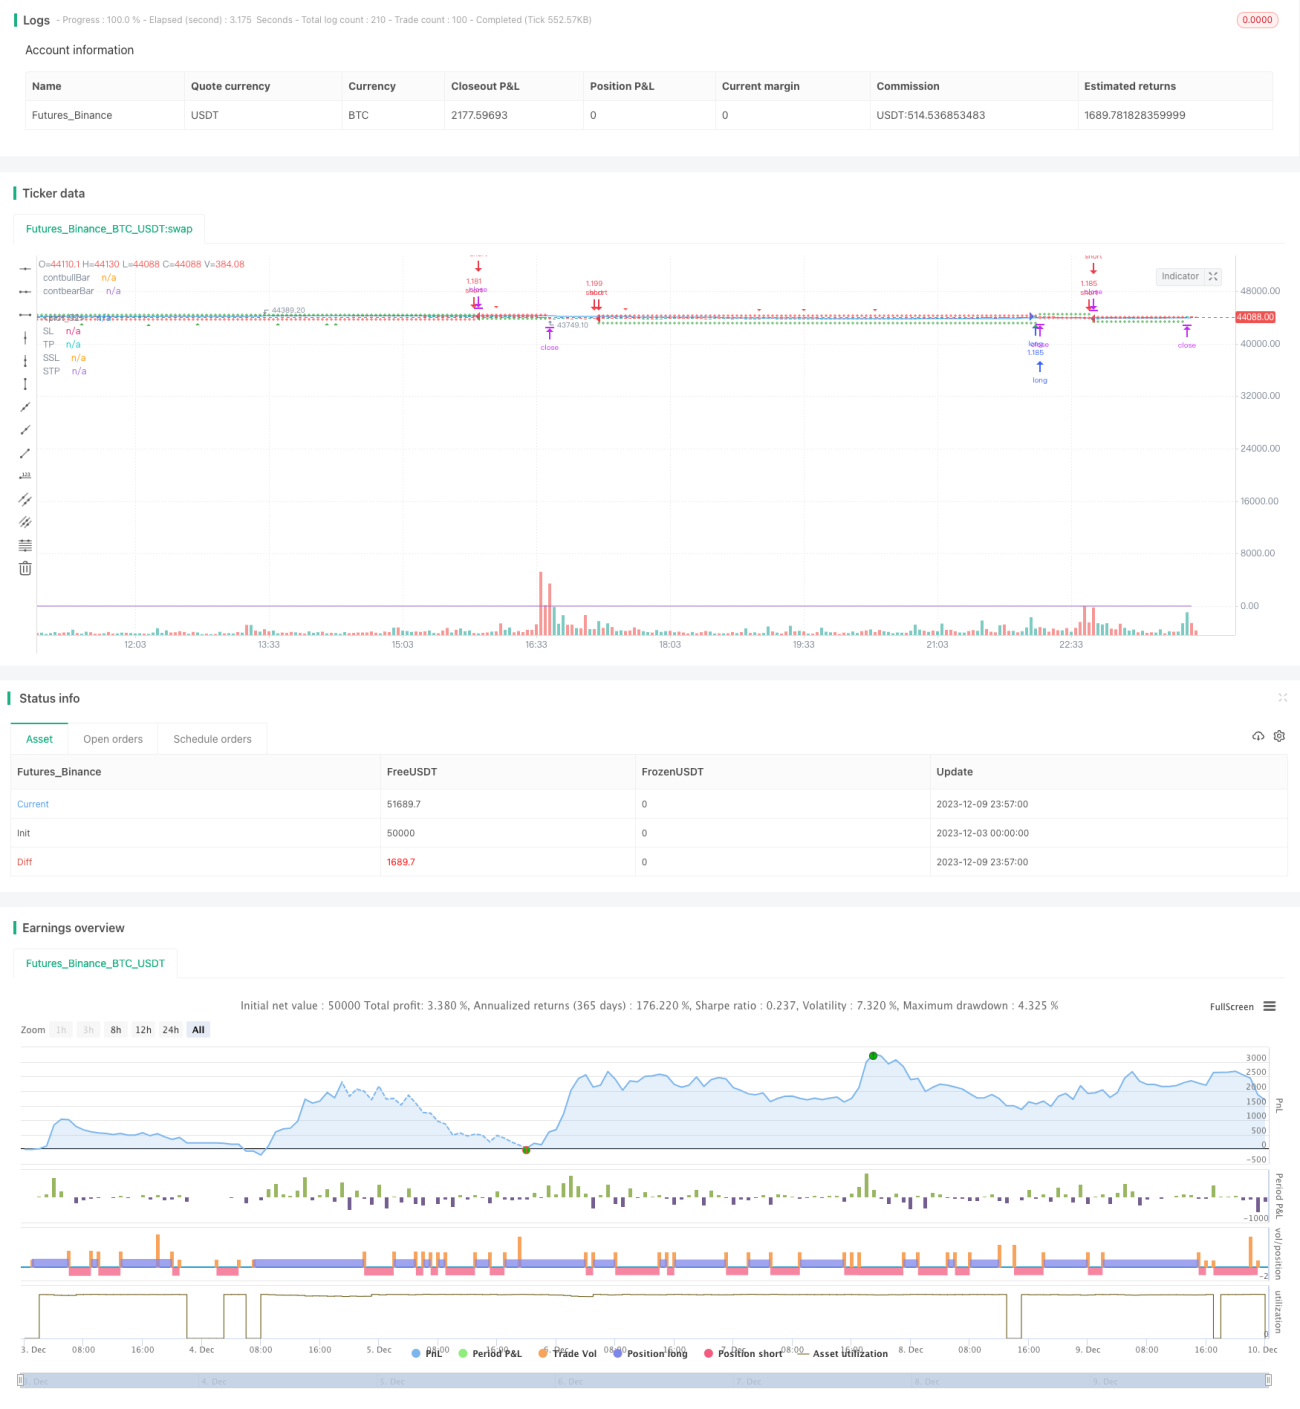
/*backtest
start: 2023-12-03 00:00:00
end: 2023-12-10 00:00:00
period: 3m
basePeriod: 1m
exchanges: [{"eid":"Futures_Binance","currency":"BTC_USDT"}]
*/

// This source code is subject to the terms of the Mozilla Public License 2.0 at https://mozilla.org/MPL/2.0/

// From "Day Trading Cryptocurrency
// Strategies, Tactics, Mindset, and Tools Required To Build Your - 1