Estrategias de indicadores de swing trading

Descripción general
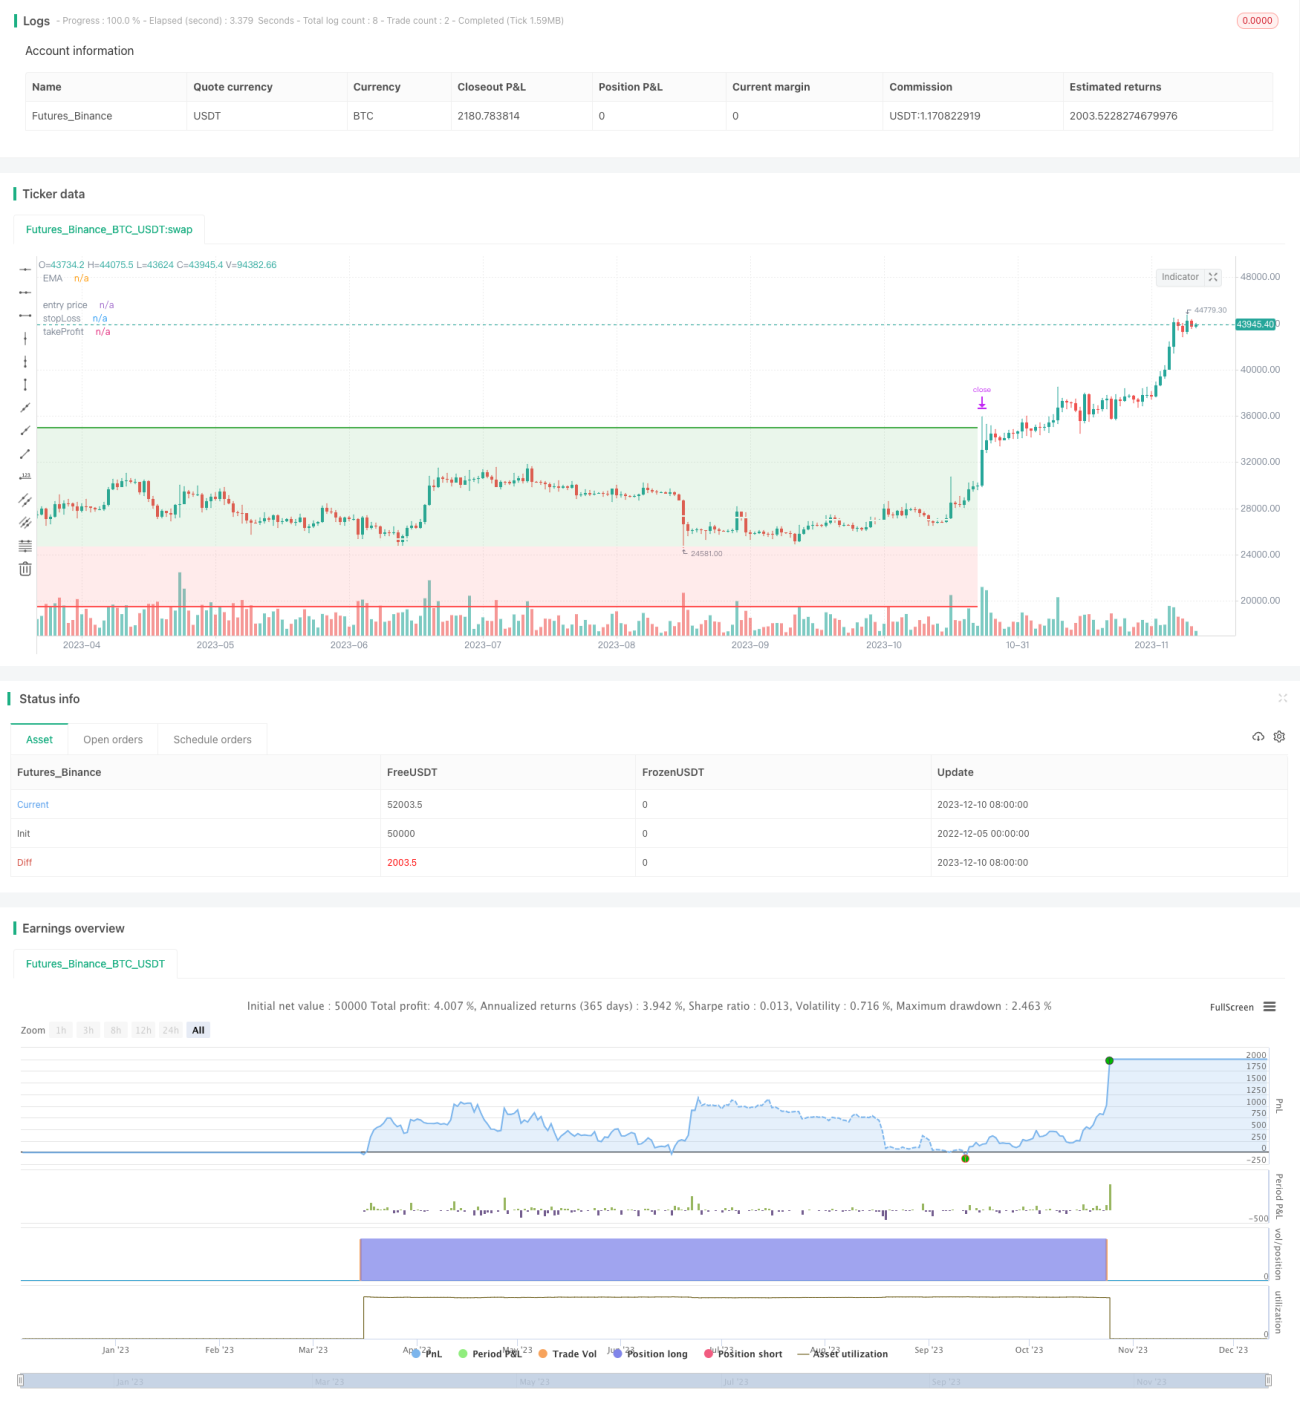
La estrategia utiliza el indicador de medias móviles (MACD) para construir señales de pluralidad, invertir en condiciones de buena tendencia y obtener ganancias mediante la configuración dinámica de las posiciones fuera de campo.
Principio de estrategia
La estrategia se basa principalmente en el indicador MACD para generar una señal de forcado de oro y una señal de forcado de vacío. Concretamente, la línea MACD genera una señal de forcado de oro cuando la línea MACD cruza la línea de señal de abajo hacia arriba y una señal de forcado de vacío cuando la línea MACD cruza la línea de señal de arriba hacia abajo.
Cuando la señal de la horca de oro viene, si el precio de cierre es superior a la línea media de la EMA, haga más; cuando la señal de la horca muerta viene, si el precio de cierre es inferior a la línea media de la EMA, haga un vacío. Esto puede garantizar la inversión de operaciones bajo la gran tendencia.
Después de la entrada, la estrategia utiliza el stop loss y el stop loss para detener el stop loss dinámicamente. En concreto, el precio de entrada se configura como un solo stop loss.(1- la mayor caída); el stop se establece como el precio de entrada(1+TARGET_STOP_RATIO*El valor máximo de la caída es el inverso del valor de la opción en blanco. El valor máximo de la caída se calcula de forma dinámica y representa el porcentaje de caída del precio de la caída desde el swing low hasta el cierre. El valor por defecto de la opción en blanco es 2, y el valor de la caída es 2.
La ventaja de esta configuración es que se puede ajustar dinámicamente la tasa de pérdidas y los puntos de parada en función de las fluctuaciones del mercado. Se puede detener rápidamente la salida en grandes fluctuaciones y rastrear los paros en pequeñas fluctuaciones.
Ventajas estratégicas
-
El indicador MACD se utiliza para construir señales de pluralidad de huecos, lo que permite determinar con eficacia el momento de la reversión de los precios.
-
En combinación con la línea media de la EMA como filtro, elegir el estado de tendencia al alza al entrar en juego, evitar el comercio en contra.
-
Sistema de control de salida dinámico, que permite ajustar en tiempo real la tasa de ganancias y pérdidas, los puntos de parada, y controlar el riesgo al mismo tiempo para lograr una alta ganancia.
-
Debido a las fluctuaciones del mercado, la salida es rápida, lo que reduce el tiempo de salida a bolsa y es más adecuado para los inversores ocupados.
Riesgos estratégicos y soluciones
-
Los indicadores MACD generan frecuentemente falsas señales en mercados con un orden horizontal. La solución es agregar la línea de equilibrio como filtro para evitar el comercio inverso.
-
En un mercado con extrema volatilidad, el DYNAMIC STOP puede causar un alto demasiado suave, pero en la mayoría de los casos funciona mejor. Si se encuentra con situaciones extremas, se puede considerar un índice de pérdidas fijas.
-
El espacio para obtener ganancias es limitado, y se requiere un comercio frecuente para obtener ganancias. Esto requiere que los inversores tengan cierta capacidad de resistencia psicológica y tiempo de inversión. Si no tienen tiempo libre para operar, se puede considerar adaptarse a un ciclo alto.
Dirección de optimización
-
Ajuste los parámetros MACD de acuerdo con las características específicas de la variedad, para optimizar el efecto de las operaciones de forcados dorados y forcados muertos.
-
Prueba diferentes promedios móviles como indicadores de tendencias y busca mejores filtros.
-
Prueba de la TARGET_STOP_RATIO, método de cálculo de la máxima caída y optimización de la estrategia de stop loss.
-
Aumentar la calidad de las señales mediante la adición de otros criterios, como cambios en el volumen de transacciones y la volatilidad.
-
Intentar refinar más características con algoritmos de aprendizaje automático, construir modelos dinámicos multifactoriales y lograr un stop-loss más inteligente.
Resumir
La estrategia en su conjunto tiene una gran utilidad. Con el MACD como la señal de negociación central, el aumento de la tendencia de juicio y el control de salida dinámica de dos módulos auxiliares, puede mejorar significativamente la eficacia de la negociación MACD sí mismo. La estrategia de stop loss es el foco de la optimización de la estrategia, la estrategia en este sentido ha realizado una gran cantidad de innovaciones, que vale la pena más investigación y aplicación.
- 1