Estrategia del indicador del índice de comerciantes dinámicos
Descripción general
La estrategia se basa en el índice de comerciantes dinámicos (TDI) y el indicador de canal de acción de precios (PAC), combinado con el canal de la banda de Brin, el índice de fuerza relativa (RSI) y el indicador MACD, para lograr un sistema de seguimiento de tendencias.
La estrategia se utiliza principalmente para detectar tendencias y generar señales de negociación cuando hay cambios significativos en la dirección de la tendencia. Combina varios indicadores para mejorar la reproducción de señales y la calidad de la señal.
Principio de estrategia
La estrategia se centra en el indicador TDI. El TDI se compone de varios subíndices superpuestos, que incluyen:
- El índice de fuerza relativa (RSI): la fuerza de los precios de reacción
- El Canal de la Franja de Brin: rango de fluctuación de los precios de reacción
- Líneas de precios del RSI: un promedio móvil simple del RSI que refleja la tendencia de los precios del RSI
- Líneas de señales de comercio RSI: otro promedio móvil simple del RSI para generar señales de comercio
Cuando la línea de precios RSI y la línea de señales de transacción RSI aparecen en el cruce de la barra de oro es una señal de compra; cuando las dos líneas aparecen en el cruce de la barra de muerte es una señal de venta. La línea de señales de transacción cruzando la línea media también produce una señal más débil.
Además, la estrategia también combina el indicador de la acción del precio en el canal. El indicador calcula el canal de precios en función de los precios más altos y más bajos en el período de tiempo. Cuando el precio se acerca a la parte superior o inferior del canal, indica que puede haber una oportunidad de reversión.
Para filtrar los informes erróneos, la estrategia también introdujo el indicador MACD. La señal de entrada se activa solo cuando el color de la columna MACD coincide con la dirección de la señal comercial.
Ventajas estratégicas
En comparación con un solo indicador, la estrategia combina las ventajas de varios indicadores:
- Los indicadores de TDI son más sensibles a los cambios de tendencia
- El canal de acción de los precios refleja claramente soportes y presiones
- El MACD puede filtrar los informes falsos
Además, en comparación con indicadores de seguimiento de tendencias como las medias móviles, el TDI es más sensible a la reversión de la tendencia, lo que reduce las pérdidas innecesarias.
La estrategia también puede adaptarse a diferentes entornos de mercado a través de parámetros.
Riesgo estratégico
- Múltiples indicadores superpuestos y ajuste de parámetros complejo
- La frecuencia de las transacciones puede ser excesiva, aumentando los costos de las transacciones y el riesgo de deslizamiento
- La identificación inversa no es 100% precisa y puede perderse la tendencia de que el precio continúe en una dirección
- Los cambios de precios en el comercio en vivo son mucho más complejos que el retroceso, y los efectos de la señal son difíciles de replicar
Se pueden reducir las pérdidas individuales mediante la ampliación del margen de pérdida. La combinación de parámetros de optimización mejora la calidad de la señal. La flexibilidad adecuada de las condiciones de entrada reduce la frecuencia de las operaciones.
Dirección de optimización
- Ajustar los parámetros del TDI para encontrar la combinación óptima
- Ajuste de la longitud del canal de acción de precios para optimizar la identificación de la resistencia de soporte
- Ajuste de los parámetros MACD para optimizar el efecto de filtro de entrada
- Añadir gestión de posiciones y estrategias de stop loss móviles
Resumir
La estrategia utiliza una variedad de indicadores para determinar tendencias y oportunidades de reversión. Se puede ajustar por parámetros para adaptarse a las diferentes variedades. Tiene cierto valor en el campo de batalla, pero el efecto de la señal está cerca de la perfección.
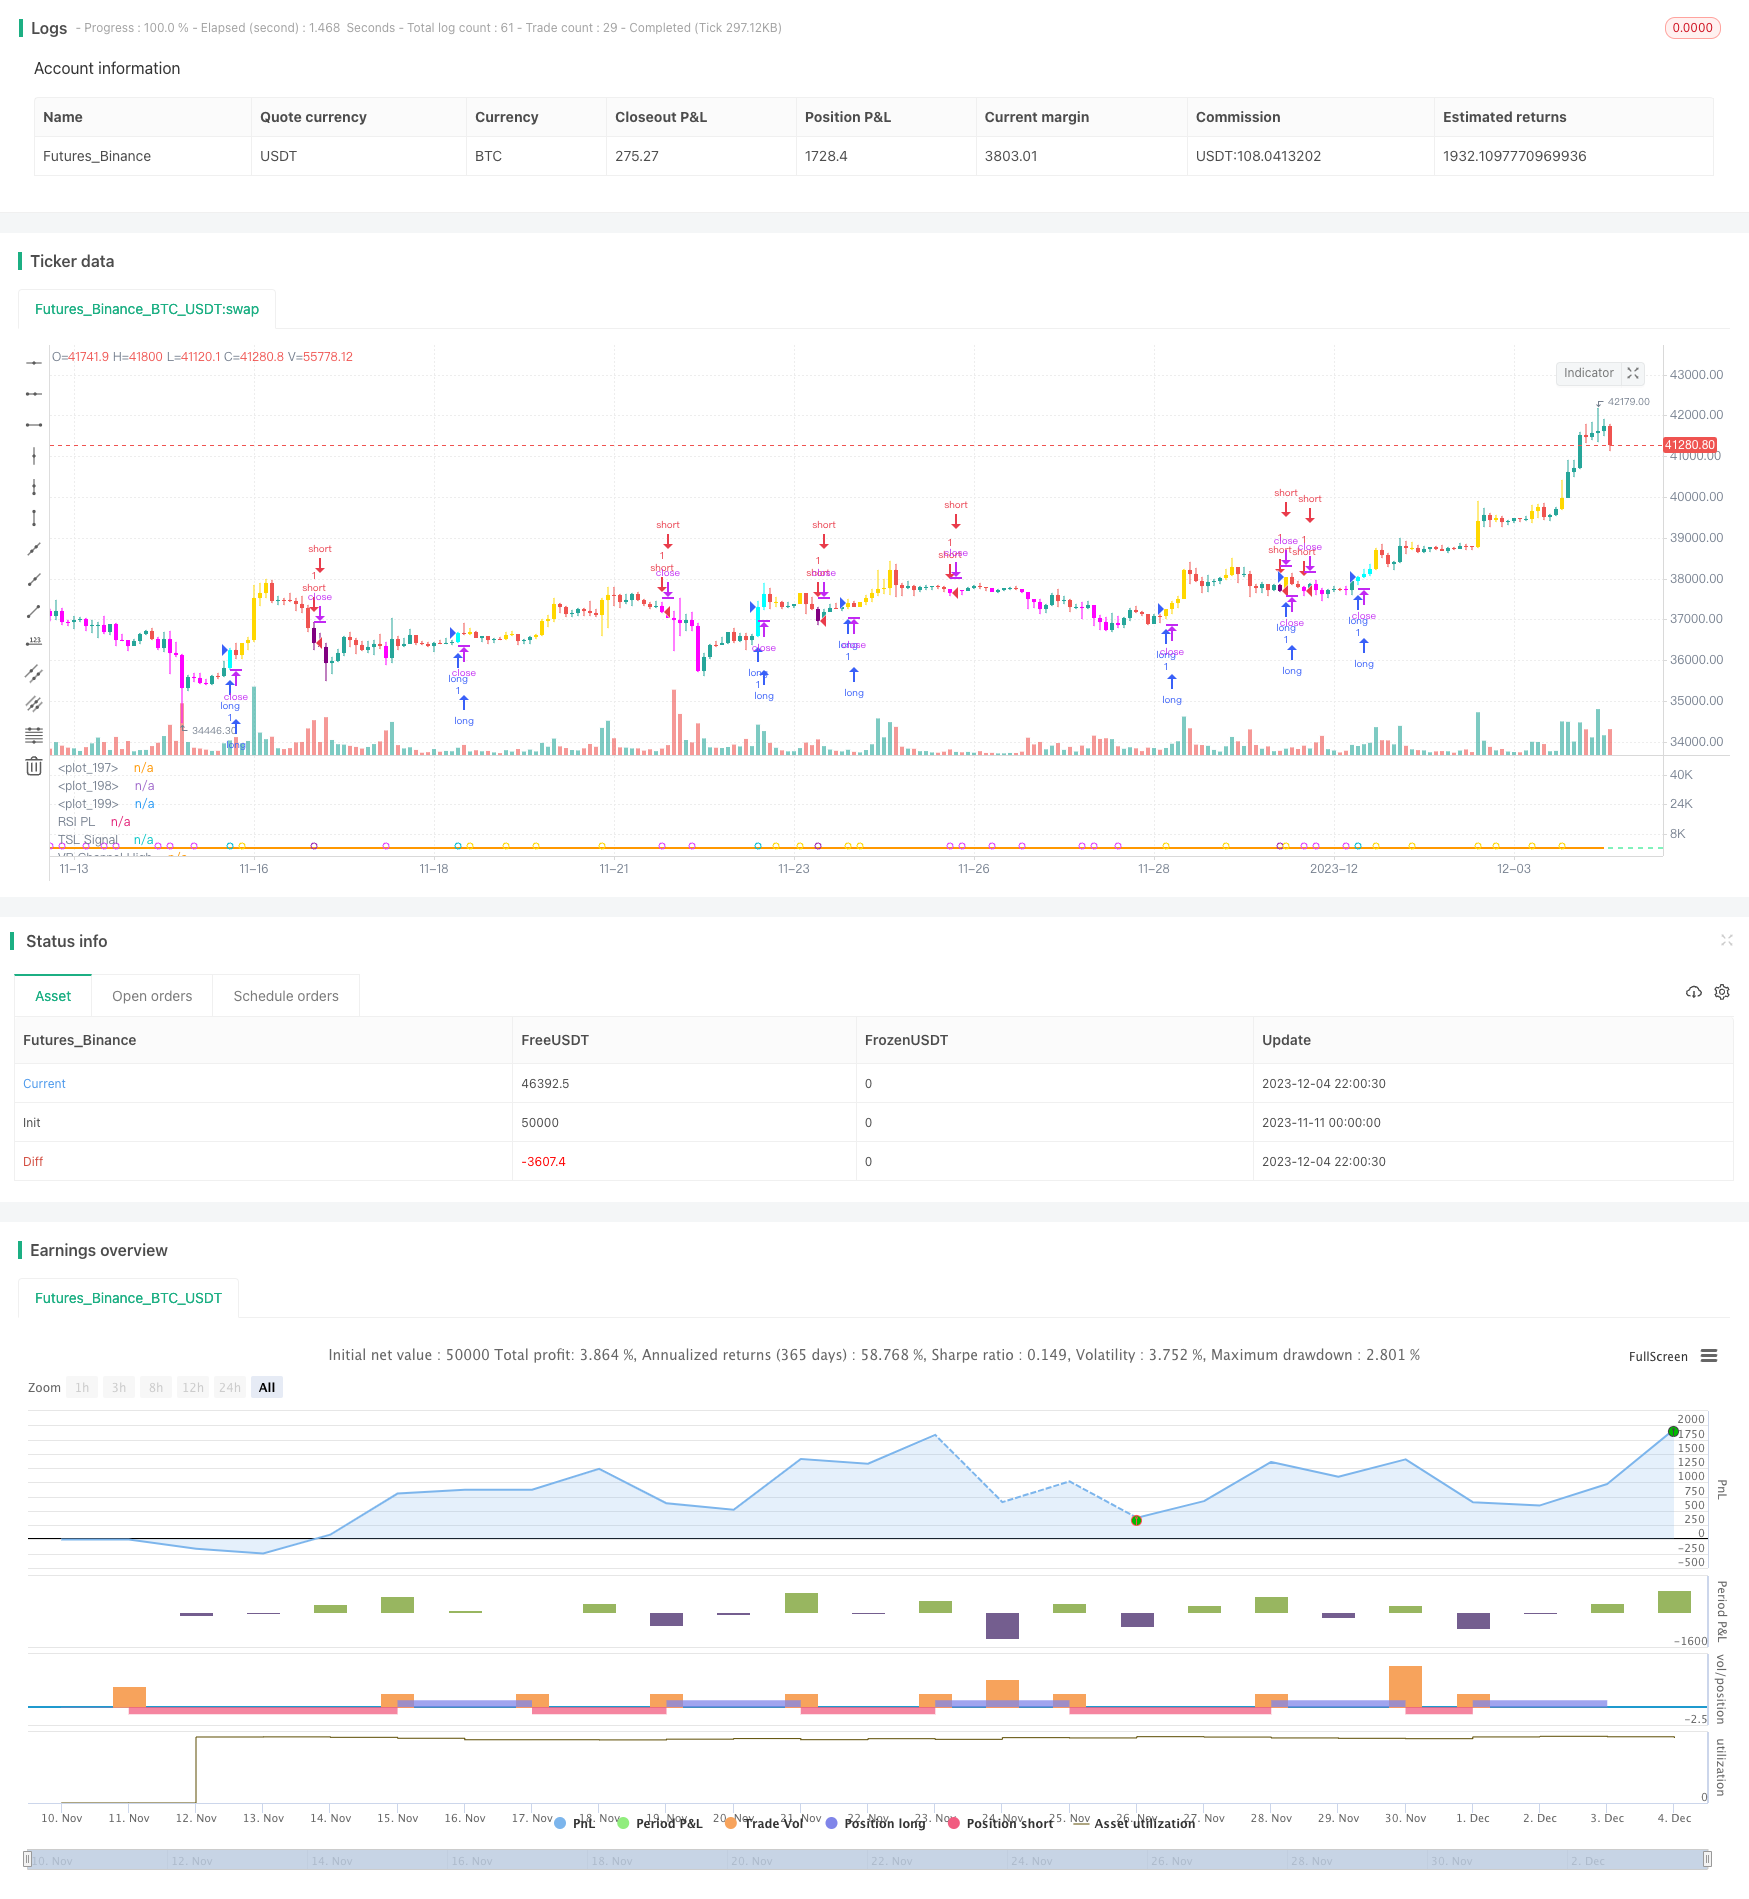
/*backtest
start: 2023-11-11 00:00:00
end: 2023-12-05 00:00:00
period: 2h
basePeriod: 15m
exchanges: [{"eid":"Futures_Binance","currency":"BTC_USDT"}]
*/

//@version=4
//

strategy("[BACKTEST]Traders Dynamic Index Indicator Alert by JustUncleL", shorttitle="[BACKTEST]TDIALT")

//
// author: JustUncleL
// date: 10-Oct-2019
//
// Description:
//   This script is a "strategy" version of the "Traders Dynamic Index Indicator Alert v0.1 by JustUncleL"
//   made available for backtesting to help optimize settings.
//
//   This is a Trend following system utilising the Traders Dynamic Index (TDI),
//   Price Action Channel (PAC) and Heikin Ashi candles.
//   About while ago I came across the use of TDI in "E.A.S.Y. Method" that I found in
//   forexfactory forums: http://www.forexfactory.com/attachment.php?attachmentid=686629&d=1303831008
//   and I was able to set up a chart based on the specifications by using Kurbelklaus scripts.
//   However, I found that the alerts were being generated one or two bars too late,
//   so I was not successful using it with Binary Options. Later I found a variation of the
//   method in the forums which generates alerts a bit earlier, so this indicator is a
//   variation of that early detection version.
//   The indicator can optionally use Heikin  Ashi candles only for all it's calculations,
//   I would recommend viewing the chart with normal Heikin Ashi candles, these
//   smooth out the trends and makes them more visible.
//
//   I found that this metod it works OK with currency pairs or commodities.
//   It also seems to work well with 5min+ timeframe charts,
//   and for Binary Options I would suggest expiry of 2 to 6 candles.
//
//   ALERT GENERATION:
//   =================
//
//   The TDI (Traders Dynamic Index)
//   -------------------------------
//   Volatility Band VB(34), color: Blue, buffer: UpZone, DnZone
//   Relative Strength Index RSI(13)
//   RSI PRICE LINE (2), color: Green, buffer: mab
//   RSI TRADE SIGNAL LINE (7), color: Red, buffer: mbb
//   MARKET BASE LINE MID VB(34), color: Orange, buffer: mid
//
//   Indicator SignalLevels:
//   -----------------------
//   RSI_OversoldLevel : 22 (normally: 32)
//   RSI_OverboughtLevel : 78 (normally: 68)
//
//   Alert Conditions:
//   -----------------
//   Strong Buy (yellow): HIGH>PAC upper && BULL Candle && Candle High>PAC High && RSI>TRADE SIGNAL LINE && RSI>RSI_OversoldLevel &&
//                        && RSI<RSI_OverboughtLevel && TRADE SIGNAL LINE> MARKET BASE LINE
//   Medium Buy (aqua): HIGH>PAC upper && BULL Candle && Candle High>PAC High && RSI>TRADE SIGNAL LINE && RSI>RSI_OversoldLevel
//                        && RSI<RSI_OverboughtLevel && RSI> MARKET BASE LINE && TRADE SIGNAL LINE< MARKET BASE LINE
//   Weak Buy (blue):   HIGH>PAC upper && BULL Candle && Candle High>PAC High && RSI>TRADE SIGNAL LINE && RSI>RSI_OversoldLevel
//                        && RSI<RSI_OverboughtLevel && TRADE SIGNAL LINE<MARKET BASE LINE && RSI< MARKET BASE LINE
//
//   Strong Sell (fuchsia): LOW<PAC lower && BEAR Candle && Candle Low>PAC Low && RSI<TRADE SIGNAL LINE && RSI>RSI_OversoldLevel
//                        && RSI<RSI_OverboughtLevel && TRADE SIGNAL LINE< MARKET BASE LINE
//   Medium Sell (purple): LOW<PAC lower && BEAR Candle && Candle Low>PAC Low && RSI<TRADE SIGNAL LINE && RSI>RSI_OversoldLevel
//                           && RSI<RSI_OverboughtLevel && RSI< MARKET BASE LINE && TRADE SIGNAL LINE> MARKET BASE LINE
//   Weak Sell (black): LOW<PAC lower && BEAR Candle && Candle Low>PAC Low && RSI<TRADE SIGNAL LINE && RSI>RSI_OversoldLevel
//                        && RSI<RSI_OverboughtLevel && TRADE SIGNAL LINE> MARKET BASE LINE && RSI> MARKET BASE LINE
//
//   HIGH LEVEL FILTER (Overbought): RSI>=RSI_OverboughtLevel or MACD Histogram not green
//   LOW LEVEL FILTER (Oversold): RSI<=RSI_OversoldLevel or MACD Histogram not red
//
//   Hints on How to use:
//   --------------------
//   - When a Medium or Strong alert is generated and MACD histogram colour matches the direction
//     of the alert, then place trade in direction of alert candle and MACD.
//   - Use the multi-Hull MA's for trend direction confirmation.
//   - Best positions occur near the MACD(8,16,1) Histogram crossing the zero line.
//   - The optional coloured Dots along the bottom of the indicator represent the first alert
//     of this type that was generated in this sequence.
//   - It is advisable to trade in the direction of the main trend as indicated the HULL MA red cloud:
//     if red cloud underneath PAC then BULLISH trend, if red cloud above PAC then BEARISH trend.
//   - Selecting the HeiKin Ashi candles does affect the MACD and MA caculations, so if you select
//     normal candles the result chart will change. Although the TDI calculations and alerts will stay the
//     same.
//   - When using the Heikin Ashi candles, a good buy entry is indicated by long top wick and no bottom wick
//     for bull (green) candles and good sell entry is indicated by long bottom wick and no top wick for
//     bear (red) candles.
//   - When the MACD histogram is flat and close to zero line,
//     this indicates a ranging market, do NOT trade when this occurs.
//   - When the PAC channel on the main chart is spread apart widely, this is an indication
//     of extreme volitity and choppy chart, do NOT try to trade during these periods.
//     A choppy chart is also indicated by Heikin Ashi candles with long wicks on both sides
//     of the candles.
//   - You can specify what strength level Alerts are generated (default 2):
//     Level (1) means only generate Strong Alerts only.
//     Level (2) means generate Strong and Medium Alerts.
//     Level (3) means generate Strong, Medium and Weak Alerts.
//
//   Modifications:
//   --------------
//     11-Oct-2019
//          - Strategy Version for backtesting created.
//          - Converted to Pinescript V4
//
//     1.3  7-Aug-2017
//          - Modified Alertcondition code so that it only signals on the last completed alerted
//            candle. This should prevent some false alerts and multiple alerts being generated.
//            When setting alarms I suggest using Frequency "Once per bar (on condition)" to get
//            the earliest signal possible.
//          - Added optional alert long/short spikes that only occur on the first Long or Short//      Original code @author LazyBear for basic TDI indicator.

//            signals.
//     1.2  5-Aug-2017:
//          - Added new alerts for Buy and Sell (Long and Short) signals seperately.
//          - Upgraded to version 3 Pinescript.
//          - Added work around patch for opaque bar colouring issue.
//
//     1.1  - Modified code so when viewing Top chart with Heikin Ashi candles, calculations
//            are still based on standard candles, unless Heikin Ashi calculation option selected.
//
//     0.2  - Simplified MACD direction calculation to use just rising/falling.
//     0.1  - Oroginal Version
//   References:
//   -----------
//      Traders Dynamic Index [LazyBear]
//      KK_Traders Dynamic Index_Bar Highlighting by Kurbelklaus
//      KK_Price Action Channel (TDI BH) by Kurbelklaus
//      http://www.forexfactory.com/attachment.php?attachmentid=686629&d=1303831008
//      http://www.forexstrategiesresources.com/trading-system-metatrader-4-iv/504-traders-dynamic-index-how-to-use/
//      http://www.forexfactory.com/showthread.php?t=460148
//      http://www.forexstrategiesresources.com/scalping-forex-strategies-ii/205-scalping-with-tdi-real-macd-stochrainbow/
//
// -----------------------------------------------------------------------------
// Copyright 2016, 2017, 2019 JustUncleL
//
// This program is free software: you can redistribute it and/or modify
// it under the terms of the GNU General Public License as published by
// the Free Software Foundation, either version 3 of the License, or
// any later version.
//
// This program is distributed in the hope that it will be useful,
// but WITHOUT ANY WARRANTY; without even the implied warranty of
// MERCHANTABILITY or FITNESS FOR A PARTICULAR PURPOSE.  See the
// GNU General Public License for more details.
//
// The GNU General Public License can be found here
// <http://www.gnu.org/licenses/>.
//
// -----------------------------------------------------------------------------
//

//
lengthrsi = input(13)
lengthband = input(34)
lengthrsipl = input(2)
lengthtradesl = input(7)
lenH = input(5, minval=1, title="Price Action Channel Length")
lenL = lenH
rsiOSL = input(22, minval=0, maxval=49, title="RSI Oversold Level")
rsiOBL = input(78, minval=51, maxval=100, title="RSI Overbought Level")
strength = input(2, minval=1, maxval=3, step=1, title="Strength Level: (1)Strong (2)Medium (3)All")
sgb = input(false, title="Check Box To Turn Bars Gray")
sbr = input(true, title="Highlight TDI Alert Bars")
sal = input(true, title="Show Alert Condition Status")
uha = input(false, title="Use Heikin Ashi Candles for Calculations")
//

// Constants colours that include fully non-transparent option.
blue100 = #0000FFFF
aqua100 = #00FFFFFF
fuchsia100 = #FF00FFFF
purple100 = #800080FF
gray100 = #808080FF
gold100 = #FFD700FF
white100 = #FFFFFFFF
black100 = #000000FF
gold = #FFD700


// Use only Heikinashi Candles for all calculations or use Standard Candles for calculations.
security_1 = security(heikinashi(syminfo.tickerid), timeframe.period, close)
security_2 = security(syminfo.ticker, timeframe.period, close)
srcClose = uha ? security_1 : security_2
security_3 = security(heikinashi(syminfo.tickerid), timeframe.period, open)
security_4 = security(syminfo.ticker, timeframe.period, open)
srcOpen = uha ? security_3 : security_4
security_5 = security(heikinashi(syminfo.tickerid), timeframe.period, high)
security_6 = security(syminfo.ticker, timeframe.period, high)
srcHigh = uha ? security_5 : security_6
security_7 = security(heikinashi(syminfo.tickerid), timeframe.period, low)
security_8 = security(syminfo.ticker, timeframe.period, low)
srcLow = uha ? security_7 : security_8
//
r = rsi(srcClose, lengthrsi)
ma = sma(r, lengthband)
offs = 1.6185 * stdev(r, lengthband)
upZone = ma + offs
dnZone = ma - offs
mid = (upZone + dnZone) / 2
mab = sma(r, lengthrsipl)
mbb = sma(r, lengthtradesl)
//
hline(rsiOSL, color=color.red, linewidth=1)
hline(50, color=color.black, linewidth=1)
hline(rsiOBL, color=color.lime, linewidth=1)
// Plot the TDI
upl = plot(upZone, color=color.blue, title="VB Channel High", linewidth=2)
dnl = plot(dnZone, color=color.blue, title="VB Channel Low", linewidth=2)
midl = plot(mid, color=color.orange, linewidth=2, title="MBL")
mabl = plot(mab, color=color.green, linewidth=2, title="RSI PL")
mbbl = plot(mbb, color=color.red, linewidth=2, title="TSL Signal")
//
//create RSI TSL cloud to indicate trend direction.
fill(mabl, mbbl, color=mab > mbb ? color.green : color.red, transp=90)

// Calculate Price Action Channel (PAC)
smmaH = 0.0
smmaL = 0.0
sma_1 = sma(srcHigh, lenH)
smmaH := na(smmaH[1]) ? sma_1 : (smmaH[1] * (lenH - 1) + srcHigh) / lenH
sma_2 = sma(srcLow, lenL)
smmaL := na(smmaL[1]) ? sma_2 : (smmaL[1] * (lenL - 1) + srcLow) / lenL
//
umacd = input(false, title="Use MACD Filtering")
fastMA = input(title="MACD Fast MA Length", type=input.integer, defval=8, minval=2)
slowMA = input(title="MACD Slow MA Length", type=input.integer, defval=16, minval=7)
signal = input(title="MACD Signal Length", type=input.integer, defval=1, minval=1)
//
//
[currMacd, _, _] = macd(srcClose[0], fastMA, slowMA, signal)
rising_1 = rising(currMacd, 2)
falling_1 = falling(currMacd, 2)
macdH = currMacd > 0 ? rising_1 ? color.green : color.red :
   falling_1 ? color.red : color.green

//
// Bar - Highlighting  based on indication strength
long = (not umacd or macdH == color.green) and mab > mbb and mab < rsiOBL and
   mab > rsiOSL and srcHigh > smmaH and srcClose > srcOpen ?
   mbb > mid ? 1 : mab > mid and mbb < mid ? 2 : mab < mid and mbb < mid ? 3 : 0 : 0
short = (not umacd or macdH == color.red) and mab < mbb and mab < rsiOBL and
   mab > rsiOSL and srcLow < smmaL and srcClose < srcOpen ?
   mbb < mid ? 1 : mab < mid and mbb > mid ? 2 : mab > mid and mbb > mid ? 3 : 0 : 0
//
// Find the right Bar colour if enabled.
bcolor = not sbr ? na : long == 1 ? gold100 :
   long == 2 and strength > 1 ? aqua100 : long == 3 and strength > 2 ? blue100 :
   short == 1 ? fuchsia100 : short == 2 and strength > 1 ? purple100 :
   short == 3 and strength > 2 ? black100 : sgb ? gray100 : na
//
barcolor(color=bcolor, title="Bars Colours")
//
//
// === ALERT conditions
//
// create alerts only once per sequence type.
//
longCond = long > 0 and long != long[1] and long <= strength
shortCond = short > 0 and short != short[1] and short <= strength

// show dot only when alert condition is met and bar closed.
plotshape(sal and (longCond[1] or shortCond[1]), title="Alert Indicator", location=location.bottom,
          color=long[1] == 1 ? gold : long[1] == 2 ? color.aqua : long[1] == 3 ? color.blue : short[1] == 1 ? color.fuchsia : short[1] == 2 ? color.purple : short[1] == 3 ? color.black : na,
          transp=0, style=shape.circle, offset=-1)
//

// === /ALERT conditions.

// === STRATEGY ===
tradeType = input("BOTH", title="What trades should be taken : ", options=["LONG", "SHORT", "BOTH", "NONE"])

// stop loss
slPoints = input(defval=0, title="Initial Stop Loss Points (zero to disable)", minval=0)
tpPoints = input(defval=0, title="Initial Target Profit Points (zero for disable)", minval=0)

//>>>>>>>>>>>>>>>>>>>>>>>>>>>>>>>>>>>>>>>>>>>>>>>>>>>>>>>>>>>>>>>>>>>>>>>>>>>>>//

testStartYear = input(2018, "Backtest Start Year", minval=1980)
testStartMonth = input(1, "Backtest Start Month", minval=1, maxval=12)
testStartDay = input(1, "Backtest Start Day", minval=1, maxval=31)
testPeriodStart = timestamp(testStartYear, testStartMonth, testStartDay, 0, 0)

testStopYear = input(9999, "Backtest Stop Year", minval=1980)
testStopMonth = input(12, "Backtest Stop Month", minval=1, maxval=12)
testStopDay = input(31, "Backtest Stop Day", minval=1, maxval=31)
testPeriodStop = timestamp(testStopYear, testStopMonth, testStopDay, 0, 0)

testPeriod() =>
    time >= testPeriodStart and time <= testPeriodStop ? true : false

//<<<<<<<<<<<<<<<<<<<<<<<<<<<<<<<<<<<<<<<<<<<<<<<<<<<<<<<<<<<<<<<<<<<<<<<<<<<<<//

//
//set up exit parameters
TP = tpPoints > 0 ? tpPoints : na
SL = slPoints > 0 ? slPoints : na

// Make sure we are within the bar range, Set up entries and exit conditions
if testPeriod() and tradeType != "NONE"
    strategy.entry("long", strategy.long, when=longCond == true and tradeType != "SHORT")
    strategy.entry("short", strategy.short, when=shortCond == true and tradeType != "LONG")
    strategy.close("long", when=shortCond == true and tradeType == "LONG")
    strategy.close("short", when=longCond == true and tradeType == "SHORT")
    strategy.exit("XL", from_entry="long", profit=TP, loss=SL)
    strategy.exit("XS", from_entry="short", profit=TP, loss=SL)

// === /STRATEGY ===
//EOF