Estrategia de supertendencia Sunshine

Descripción general
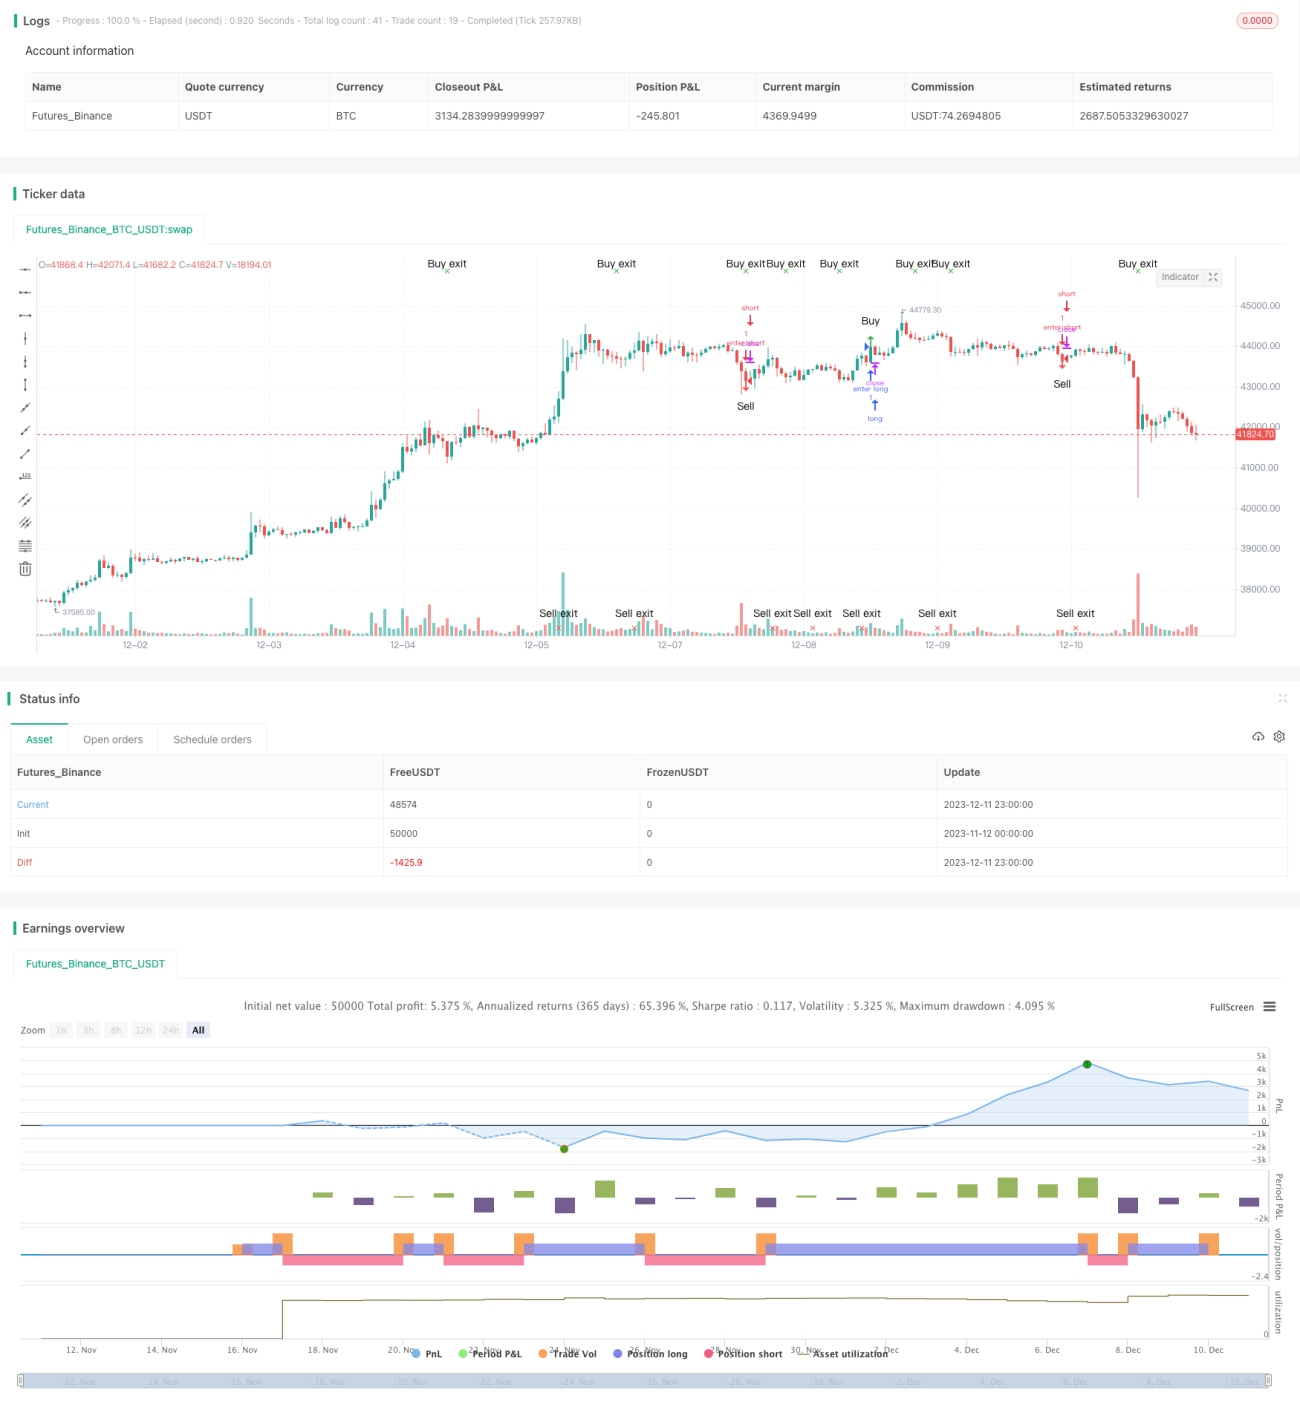
La estrategia de la súper tendencia solar es una estrategia de seguimiento de tendencias basada en los indicadores ATR y SuperTrend. Puede predecir con precisión la reversión de la tendencia y es ideal para su uso como indicador de tiempo. La estrategia puede aumentar la paciencia y la determinación de los inversores, ayudándoles a entrar y salir del mercado en el momento adecuado.
Principio de estrategia
La estrategia utiliza el indicador SuperTrend para determinar la dirección de la tendencia actual. Cuando el indicador SuperTrend cambia de dirección, consideramos que puede haber una reversión de tendencia. Además, la estrategia utiliza la dirección de la entidad de la línea K para un juicio auxiliar.
En concreto, la estrategia genera señales de negociación de acuerdo con la siguiente lógica:
- Indicadores de SuperTrend para determinar la dirección de las principales tendencias
- Cuando el indicador de SuperTrend cambia de dirección, se produce una señal de reversión potencial
- Si la dirección de la entidad de la línea K es la misma que la anterior, filtre la señal de reversión
- Si la dirección de la entidad de la línea K cambia, confirma la señal de inversión y genera una señal de transacción
Análisis de las ventajas
- El indicador SuperTrend permite determinar con precisión el punto de reversión de la tendencia
- Combinación de filtro de invalidez de la señal en la dirección de la entidad de la línea K para mejorar la calidad de la señal
- Adecuado como indicador de orden temporal para guiar a los inversores en la elección de un momento razonable de entrada y salida
- Amplia aplicación en cualquier período de tiempo y en diferentes variedades, adaptabilidad fuerte
Riesgos y soluciones
- Los indicadores de SuperTrend son propensos a generar señales excedentes y requieren un filtro auxiliar
Solución: Esta estrategia utiliza la dirección de la entidad de la línea K para el juicio auxiliar, filtrando eficazmente las señales no efectivas - La configuración de los parámetros de SuperTrend es fácil de optimizar o sobre-optimizar
Solución: usar los parámetros por defecto para evitar la optimización de los parámetros por manipulación humana - No puede manejar el cambio de tendencia tan rápido
Solución: ajuste adecuado de los parámetros del ciclo ATR para responder más rápidamente
Dirección de optimización
- Intentar una combinación diferente de parámetros del ciclo ATR
- Aumentar el volumen o el índice de fluctuación para auxiliar la filtración de señales
- Combinación con otros sistemas de indicadores para mejorar el rendimiento de la estrategia
- Desarrollo de mecanismos de detención de pérdidas y control de pérdidas individuales
Resumir
La estrategia de tendencia súper solar es una estrategia de alta eficiencia basada en el indicador SuperTrend para determinar el cambio de tendencia. Combina la dirección de la entidad de la línea K para realizar un juicio auxiliar, que puede filtrar eficazmente la señal no efectiva y mejorar la calidad de la señal. La estrategia es simple de operar, adaptable y se puede aplicar ampliamente en varias variedades y períodos de tiempo.
- 1