Estrategia de seguimiento de tendencias de cruce de MA dinámico


Fecha de creación: 2023-12-19 11:49:30 Última modificación: 2023-12-19 11:49:30
Copiar: 0 Número de Visitas: 616
1
Seguir
1621
Seguidores

Estrategia de seguimiento de tendencias de cruce de MA dinámico

Descripción general

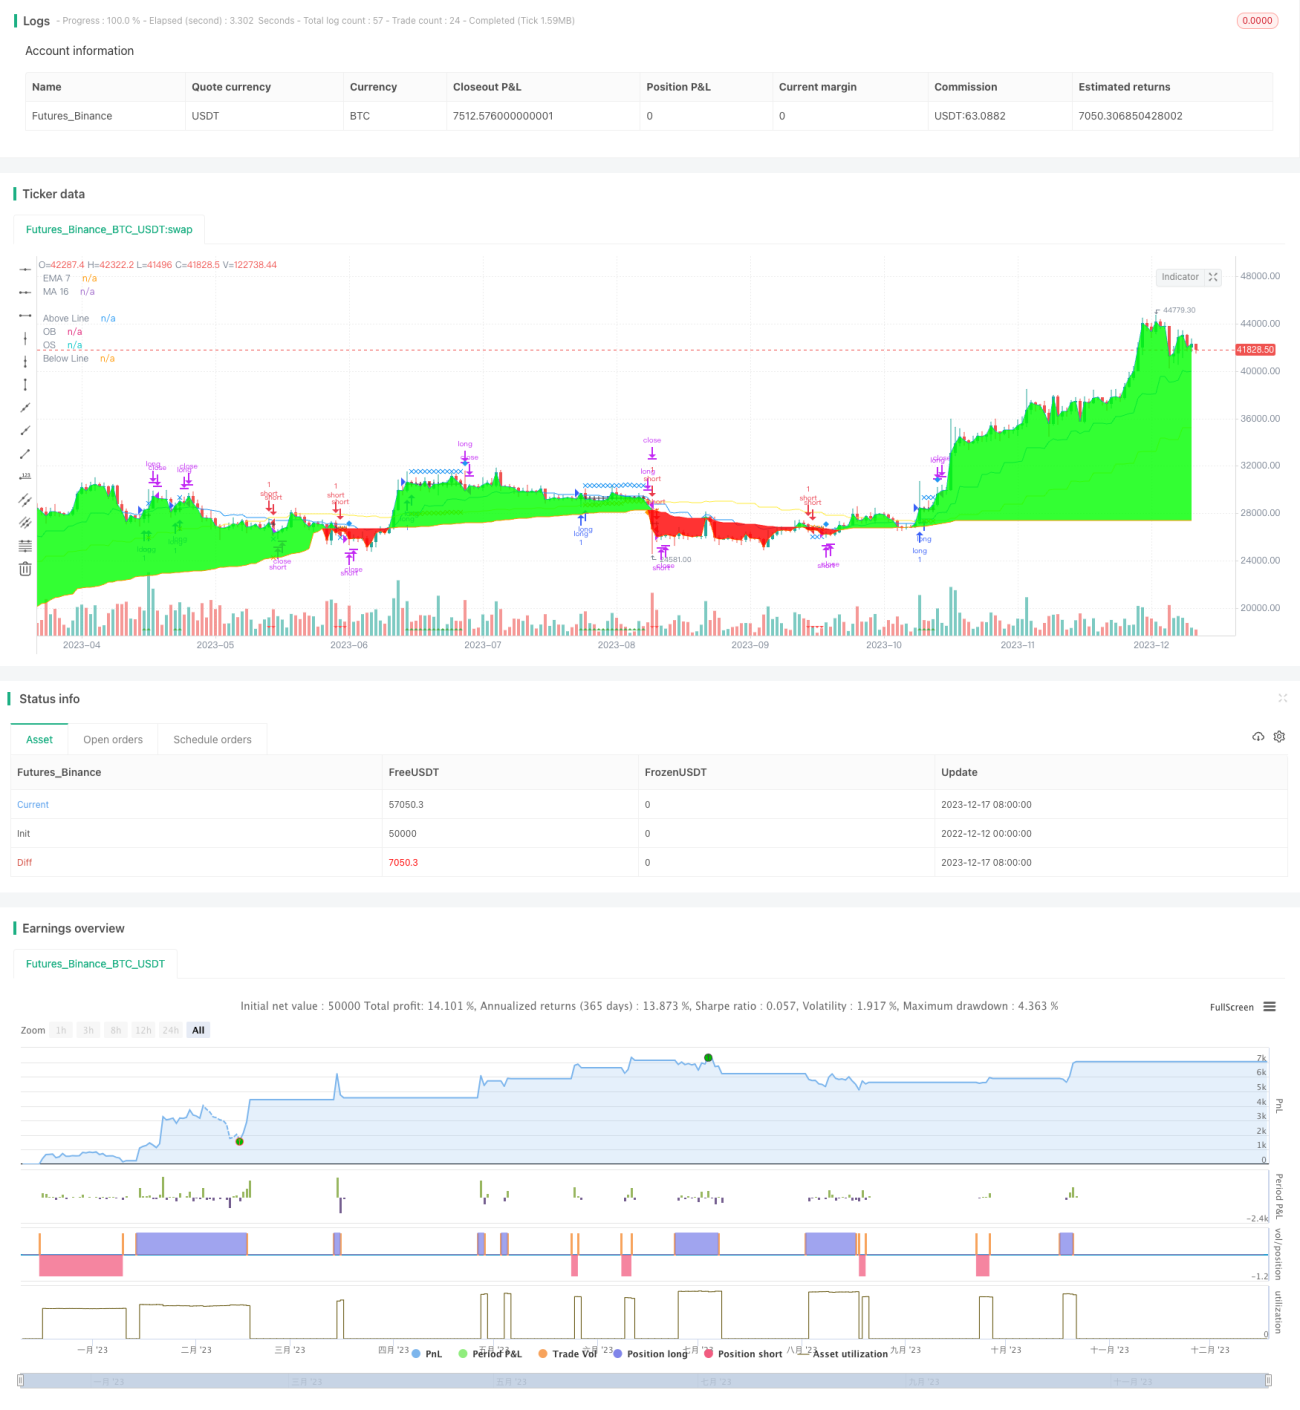
Esta estrategia se basa en la intersección de la banda de soporte de resistencia dinámica y la línea media de MA como señal de entrada, y utiliza un método de seguimiento de la tendencia para detener la pérdida y obtener ganancias de seguimiento de la línea larga.

Principio de estrategia

  1. Utilizando métodos estadísticos porcentuales para calcular los puntos de resistencia y apoyo dinámicos, se construyen las posibles zonas de reversión.

  2. Cuando el precio entra en la zona de reversión, se determina si el MA está en la línea rápida o en la línea lenta del MA, generando una señal de negociación.

  3. El sistema de seguimiento de pérdidas se activa después de la entrada, se bloquean las ganancias con un método de pérdidas dinámicas y se sigue la tendencia de ganancias.

  4. Cuando el precio dispara el punto de parada o el punto de parada, se sale de la posición.

Análisis de las ventajas

  1. La banda de soporte de resistencia dinámica identifica las áreas de posible reversión para mejorar la precisión de entrada.

  2. La línea media de MA se cruza con el canal de porcentaje, evitando falsas señales.

  3. El método de seguimiento de pérdidas puede ser eficaz para bloquear las ganancias y evitar la expansión de la retirada.

  4. Se pueden configurar varios parámetros para adaptarse a diferentes entornos de mercado.

Análisis de riesgos

  1. En situaciones de no tendencia, existe el riesgo de generar señales falsas.

  2. La configuración incorrecta de los parámetros puede provocar una entrada excesiva en el campo, por lo que se debe relajar adecuadamente.

  3. Los datos de la retroalimentación deben cubrir el ciclo de actividad adecuado, evitando limitaciones.

  4. Durante el proceso de disco duro, se debe aumentar adecuadamente el stop loss para evitar saltos.

Dirección de optimización

  1. Prueba el efecto combinado de diferentes parámetros del ciclo MA.

  2. Ajuste de los parámetros de soporte de resistencia dinámica para optimizar el efecto de reconocimiento de reversión.

  3. Evaluar el impacto de los diferentes parámetros de seguimiento de pérdidas en la curva de ganancias de la estrategia.

  4. Intentar combinar otros indicadores para filtrar la señal y mejorar la estabilidad.

Resumir

La idea general de esta estrategia es clara, utiliza la banda de soporte de resistencia dinámica para identificar las áreas que pueden revertirse como filtro de señal, y utiliza la línea media de MA para determinar la dirección de la tendencia para generar señales de negociación. El método de seguimiento de pérdidas para controlar el riesgo de manera efectiva, puede mejorar continuamente el efecto de la estrategia mediante la optimización de los parámetros, y merece mayor investigación y optimización.

Código Fuente de la Estrategia
/*backtest
start: 2022-12-12 00:00:00
end: 2023-12-18 00:00:00
period: 1d
basePeriod: 1h
exchanges: [{"eid":"Futures_Binance","currency":"BTC_USDT"}]
*/

// This source code is subject to the terms of the Mozilla Public License 2.0 at https://mozilla.org/MPL/2.0/
// © allanster

//@version=4

strategy("MA-EMA Crossover LT", shorttitle="MA-EMA XO", overlay=true)


//==================== STRATEGY CODE ======================

tradeType = input("BOTH", title="Trade Type ", options=["LONG", "SHORT", "BOTH"])

// === BACKTEST RANGE ===
FromMonth = 01//input(defval=01, title="From Month", minval=1)
FromDay = 01//input(defval=01, title="From Day", minval=1)
FromYear = input(defval=2017, title="From Year", minval=2000)
ToMonth = 12//input(defval=12, title="To Month", minval=1)
ToDay = 31//input(defval=31, title="To Day", minval=1)
ToYear = input(defval=9999, title="To Year", minval=2000)

testPeriod() =>
    time > timestamp(FromYear, FromMonth, FromDay, 00, 00) and 
       time < timestamp(ToYear, ToMonth, ToDay, 23, 59)

stopLossPercent = input(1.00, "Stop Loss Percent")
profitPercent_long = input(3.50, "Profit Percent LONG")
profitPercent_short = input(3.0, "Profit Percent SHORT")

atr_multi_PT = input(1.50, "ATR Multiple for PT")
atr_multi_SL = input(1.50, "ATR Multiple for SL")
//////////////////////////////

isLongOpen = false
isShortOpen = false

//Order open on previous ticker?
isLongOpen := nz(isLongOpen[1])
isShortOpen := nz(isShortOpen[1])

/////////////////////
//Trailing and Profit variables
trigger = 0.0
trigger := na

profitTrigger = 0.0
profitTrigger := na

//obtain values from last ticker
entryPrice = 0.0
entryPrice := nz(entryPrice[1])

stopLossLevel = 0.0
stopLossLevel := nz(stopLossLevel[1])

profitPriceLevel = 0.0
profitPriceLevel := nz(profitPriceLevel[1])


//If in active trade, lets load with current value    
if isLongOpen
    profitTrigger := profitPriceLevel ? high : na
    trigger := stopLossLevel ? ohlc4 : na
    trigger
if isShortOpen
    profitTrigger := profitPriceLevel ? low : na
    trigger := stopLossLevel ? ohlc4 : na
    trigger

isStopLoss = isLongOpen ? trigger < stopLossLevel : 
   isShortOpen ? trigger > stopLossLevel : na
isProfitCatch = isLongOpen ? profitTrigger > profitPriceLevel : 
   isShortOpen ? profitTrigger < profitPriceLevel : na

//===================      Optional Entry Condition    ============
src    = close
len = input(defval = 128, title = "DZ Length", type = input.integer, minval = 1)
// use_dz = input(false, title="Use Dynamic Zone")
pcntAbove = input(defval = 40, title = "Hi is Above X% of Sample", type = input.float, minval = 0, maxval = 100, step = 1.0)
pcntBelow = input(defval = 60, title = "Lo is Below X% of Sample", type = input.float, minval = 0, maxval = 100, step = 1.0)

smplAbove = percentile_nearest_rank(src, len, pcntAbove)
smplBelow = percentile_nearest_rank(src, len, 100 - pcntBelow)

above     = plot(src > smplAbove ? src : smplAbove, title = "Above Line", color = na)
probOB    = plot(smplAbove, title = "OB", color = color.green)
probOS    = plot(smplBelow, title = "OS", color = color.red)
below     = plot(src < smplBelow ? src : smplBelow, title = "Below Line", color = na)
fill(above,  probOB, color = #00FF00, transp = 80)
fill(below,  probOS, color = #FF0000, transp = 80)

// long_dz = close > smplAbove
// short_dz = close < smplBelow


//==============           Entry Conditions        =====================
timeframe = input("5D", title="MA16 Resolution", type=input.resolution)
_ma = sma(hlc3, 16)
ma=security(syminfo.tickerid, timeframe, _ma, barmerge.gaps_off, barmerge.lookahead_on)

_ema=ema(hlc3,7)
ema=security(syminfo.tickerid, timeframe, _ema, barmerge.gaps_off, barmerge.lookahead_on)


long = ma[1] > ema[1] ? crossover(ema, ma) : abs(ma - ema)/ma > 0.025 ? crossover(close, ema) : false
short = ma[1] < ema[1] ? crossunder(ema,ma) : abs(ma - ema)/ma > 0.025 ? crossunder(close, ema): false //:crossunder(close, ema) 

longEntry = (tradeType == "LONG" or tradeType == "BOTH") and long
shortEntry = (tradeType == "SHORT" or tradeType == "BOTH") and short

//Upon Entry, do this.
if longEntry or shortEntry
    entryPrice := ohlc4
    entryPrice

//set price points for new orders
use_dz_sl = input(true, title="Use DZ SL")
if isLongOpen 
    stopLossLevel := use_dz_sl? max(smplAbove, ma) : ema - 0.25*atr_multi_PT* atr(32) //ma
    profitTrail = ma + atr_multi_PT* atr(32)
    profitPriceLevel :=  max( (1 + 0.01 * profitPercent_long) * entryPrice, profitTrail)
    profitPriceLevel
if isShortOpen 
    stopLossLevel :=  use_dz_sl? min(smplBelow, ma) : ema + 0.25*atr_multi_PT* atr(32) //ma
    profitTrail = ma - atr_multi_PT* atr(32)
    profitPriceLevel := min( (1 - 0.01 * profitPercent_short) * entryPrice, profitTrail)
    profitPriceLevel

shortExit = isShortOpen[1] and (isStopLoss or isProfitCatch or longEntry)
longExit = isLongOpen[1] and (isStopLoss or isProfitCatch or shortEntry)


if (longExit or shortExit) and not(longEntry or shortEntry)
    trigger := na
    profitTrigger := na
    entryPrice := na
    stopLossLevel := na
    profitPriceLevel := na
    // highest := na
    // lowest := na
    // lowest

if testPeriod() and (tradeType == "LONG" or tradeType == "BOTH")
    strategy.entry("long", strategy.long, when=longEntry)
    strategy.close("long", when=longExit)

if testPeriod() and (tradeType == "SHORT" or tradeType == "BOTH")
    strategy.entry("short", strategy.short, when=shortEntry)
    strategy.close("short", when=shortExit)


//If the value changed to invoke a buy, lets set it before we leave
isLongOpen := longEntry ? true : longExit == true ? false : isLongOpen
isShortOpen := shortEntry ? true : shortExit == true ? false : isShortOpen


plotshape(isShortOpen, title="Short Open", color=color.red, style=shape.triangledown, location=location.bottom)
plotshape(isLongOpen, title="Long Open", color=color.green, style=shape.triangleup, location=location.bottom)

plotshape(entryPrice ? entryPrice : na, title="Entry Level", color=color.black, style=shape.cross, location=location.absolute)
plotshape(stopLossLevel ? stopLossLevel : na, title="Stop Loss Level", color=color.orange, style=shape.xcross, location=location.absolute)
plotshape(profitPriceLevel ? profitPriceLevel : na, title="Profit Level", color=color.blue, style=shape.xcross, location=location.absolute)
plotshape(profitTrigger[1] ? isProfitCatch : na, title="Profit Exit Triggered", style=shape.diamond, location=location.abovebar, color=color.blue, size=size.small)
plotshape(trigger[1] ? isStopLoss : na, title="Stop Loss Triggered", style=shape.diamond, location=location.belowbar, color=color.orange, size=size.small)

plot(ma, title="MA 16", color=color.yellow)
plot(ema, title="EMA 7", color=color.blue)