
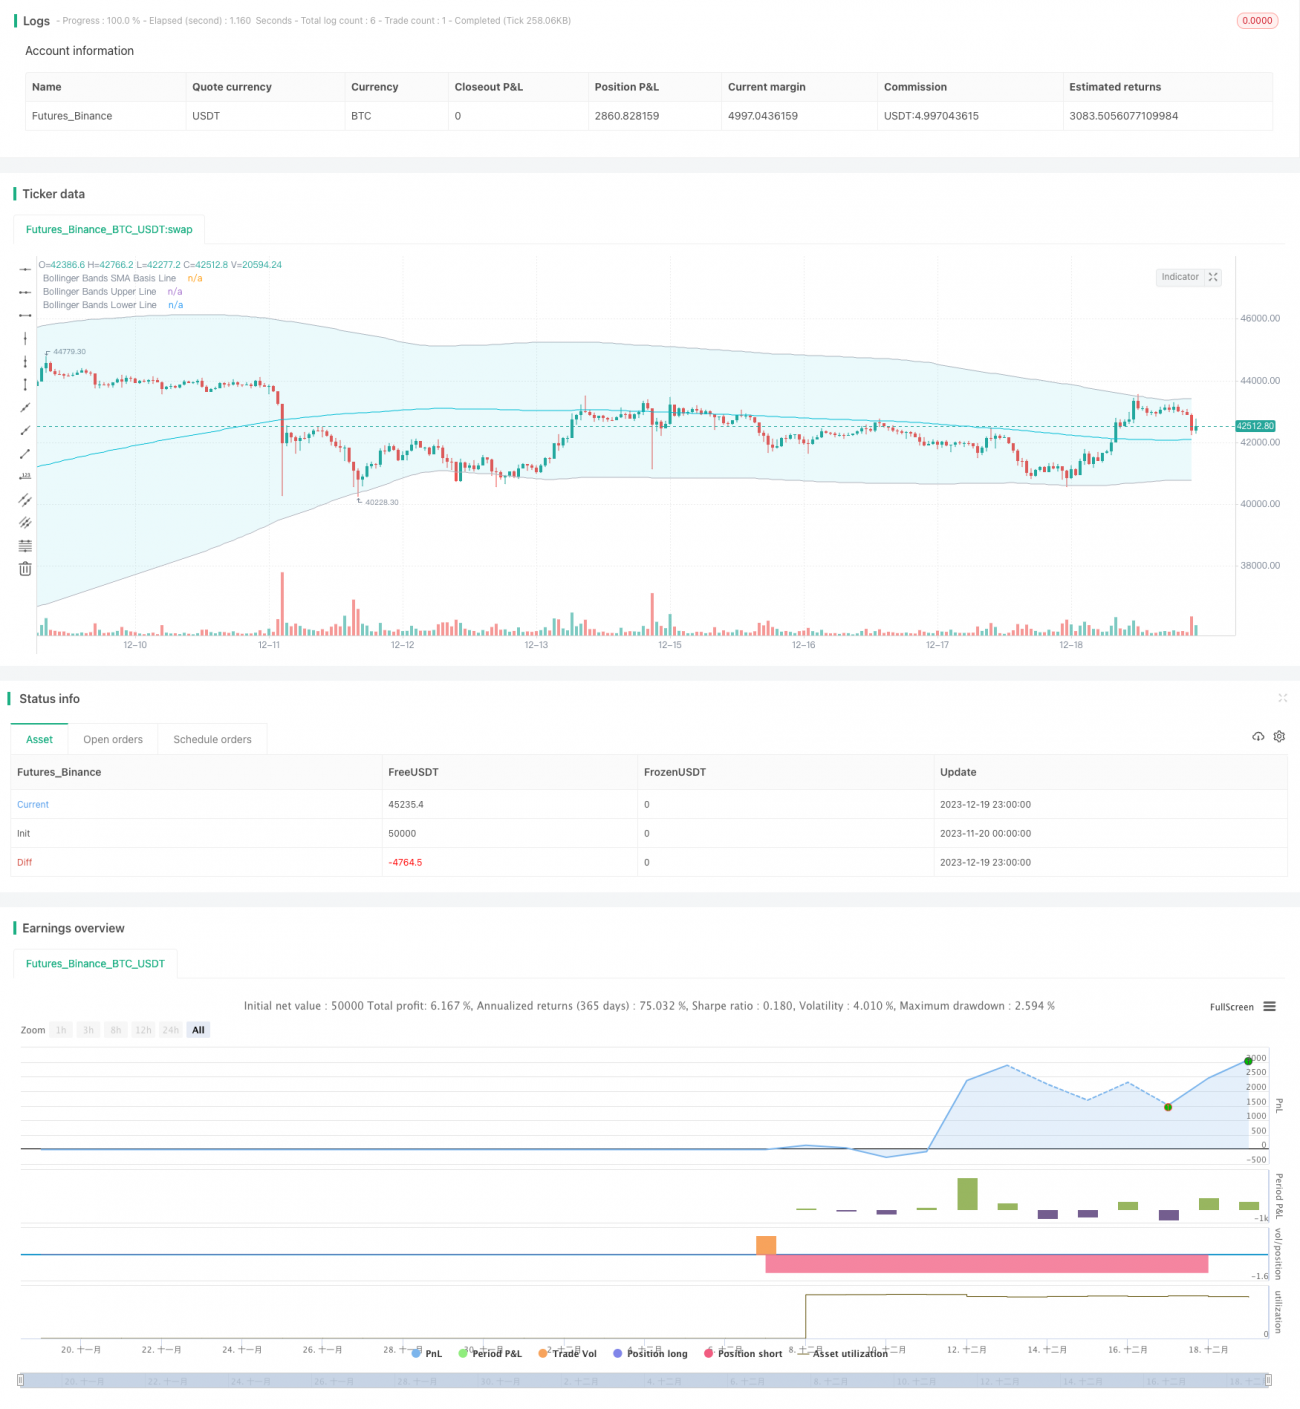
Esta estrategia se llama estrategia de parada de pérdidas de la banda de Bollinger RSI (RSI Bollinger Bands TP/SL Strategy). Esta estrategia combina el indicador RSI con el indicador de la banda de Bollinger para posicionar la tendencia y realizar operaciones de ruptura.
El indicador RSI puede determinar si una acción está en el rango de sobreventa cuando el RSI es mayor que la línea de sobreventa establecida y es sobreventa cuando es menor que la línea de sobreventa establecida. Esta estrategia establece la línea de sobreventa en 50 y la línea de sobreventa en 50.
La banda de Bryn se obtiene calculando la diferencia estándar del precio de la acción. La línea de resistencia es la línea de resistencia y la línea de apoyo es la línea de apoyo.
Cuando el indicador RSI aparece una señal de inversión inferior, mientras que el precio de las acciones rompe la banda de Brin hacia abajo, considere que el movimiento se invierte de abajo hacia arriba, haga más; cuando el indicador RSI aparece una señal de inversión superior, mientras que el precio de las acciones cae por encima de la banda de Brin, considere que el movimiento se invierte de arriba hacia abajo, haga un vacío.
El indicador RSI y el indicador de las bandas de Brin se utilizan para determinar tendencias y puntos de reversión. El uso de ambos en combinación puede mejorar la precisión de identificación de señales de compra y venta reales y evitar falsas rupturas.
La estrategia establece un punto de parada para detener la pérdida, haciendo un punto de parada adicional como precio de entradaEl precio de entrada es el punto de parada.(1- Proporción de Stop Loss); por el contrario, el shorting puede bloquear ganancias, evitar pérdidas al máximo y controlar el riesgo.
La estrategia puede ser solo de largo plazo, solo de corto plazo o bidireccional, y los usuarios pueden elegir diferentes direcciones según el entorno del mercado, controlando el riesgo de manera flexible.
El tamaño estándar de la banda de Brin influye en el ancho de la banda de Brin, lo que afecta a la generación de señales de transacción. Si los parámetros no se ajustan correctamente, puede generar una gran cantidad de señales erróneas.
En caso de una reversión de tipo V, la configuración de stop-loss puede ser demasiado radical y causar pérdidas innecesarias.
Los parámetros del RSI también afectan a la forma de la curva RSI. Si los parámetros del RSI se establecen incorrectamente, la precisión de la señal de inversión del RSI disminuye.
Se pueden probar más parámetros de longitud RSI para encontrar la combinación de parámetros óptima.
Se pueden probar más longitudes de banda de Brin y parámetros de diferencia estándar para encontrar la combinación óptima de parámetros.
Se puede encontrar el parámetro óptimo para el Stop Loss Ratio a través de la retroalimentación.
Esta estrategia utiliza el indicador RSI y el indicador de la banda de Brin para evaluar la tendencia y la reversión, y se agrega el control de riesgo del mecanismo de stop-loss, que puede identificar automáticamente los puntos de compra y venta y detener el stop-loss a tiempo. La estrategia también tiene ciertos riesgos, y se puede mejorar principalmente mediante métodos como la optimización de parámetros.
/*backtest
start: 2023-11-20 00:00:00
end: 2023-12-20 00:00:00
period: 1h
basePeriod: 15m
exchanges: [{"eid":"Futures_Binance","currency":"BTC_USDT"}]
*/
// This source code is subject to the terms of the Mozilla Public License 2.0 at https://mozilla.org/MPL/2.0/
// © BigCoinHunter
//@version=5
strategy(title="RSI_Boll-TP/SL", overlay=true,
pyramiding=0, default_qty_type=strategy.percent_of_equity,
default_qty_value=100, initial_capital=1000,
currency=currency.USD, commission_value=0.05,
commission_type=strategy.commission.percent,
process_orders_on_close=true)
//----------- get the user inputs --------------
//---------- RSI -------------
price = input(close, title="Source")
RSIlength = input.int(defval=6,title="RSI Length")
RSIoverSold = input.int(defval=50, title="RSI OverSold", minval=1)
RSIoverBought = input.int(defval=50, title="RSI OverBought", minval=1)
//------- Bollinger Bands -----------
BBlength = input.int(defval=200, title="Bollinger Period Length", minval=1)
BBmult = input.float(defval=2.0, minval=0.001, maxval=50, step=0.1, title="Bollinger Bands Standard Deviation")
BBbasis = ta.sma(price, BBlength)
BBdev = BBmult * ta.stdev(price, BBlength)
BBupper = BBbasis + BBdev
BBlower = BBbasis - BBdev
source = close
buyEntry = ta.crossover(source, BBlower)
sellEntry = ta.crossunder(source, BBupper)
plot(BBbasis, color=color.aqua, title="Bollinger Bands SMA Basis Line")
p1 = plot(BBupper, color=color.silver, title="Bollinger Bands Upper Line")
p2 = plot(BBlower, color=color.silver, title="Bollinger Bands Lower Line")
fill(plot1=p1, plot2=p2, title="Bollinger BackGround", color=color.new(color.aqua,90), fillgaps=false, editable=true)
//---------- input TP/SL ---------------
tp = input.float(title="Take Profit:", defval=0.0, minval=0.0, maxval=100.0, step=0.1) * 0.01
sl = input.float(title="Stop Loss: ", defval=0.0, minval=0.0, maxval=100.0, step=0.1) * 0.01
longEntry = input.bool(defval=true, title= 'Long Entry', inline="11")
shortEntry = input.bool(defval=true, title='Short Entry', inline="11")
//---------- backtest range setup ------------
fromDay = input.int(defval = 1, title = "From Day", minval = 1, maxval = 31)
fromMonth = input.int(defval = 1, title = "From Month", minval = 1, maxval = 12)
fromYear = input.int(defval = 2021, title = "From Year", minval = 2010)
toDay = input.int(defval = 30, title = "To Day", minval = 1, maxval = 31)
toMonth = input.int(defval = 12, title = "To Month", minval = 1, maxval = 12)
toYear = input.int(defval = 2042, title = "To Year", minval = 2010)
//------------ time interval setup -----------
start = timestamp(fromYear, fromMonth, fromDay, 00, 00) // backtest start window
finish = timestamp(toYear, toMonth, toDay, 23, 59) // backtest finish window
window() => time >= start and time <= finish ? true : false // create function "within window of time"
//------- define the global variables ------
var bool long = true
var bool stoppedOutLong = false
var bool stoppedOutShort = false
//--------- Colors ---------------
TrendColor = RSIoverBought and (price[1] > BBupper and price < BBupper) and BBbasis < BBbasis[1] ? color.red : RSIoverSold and (price[1] < BBlower and price > BBlower) and BBbasis > BBbasis[1] ? color.green : na
//bgcolor(switch2?(color.new(TrendColor,50)):na)
//--------- calculate the input/output points -----------
longProfitPrice = strategy.position_avg_price * (1 + tp) // tp -> take profit percentage
longStopPrice = strategy.position_avg_price * (1 - sl) // sl -> stop loss percentage
shortProfitPrice = strategy.position_avg_price * (1 - tp)
shortStopPrice = strategy.position_avg_price * (1 + sl)
//---------- RSI + Bollinger Bands Strategy -------------
vrsi = ta.rsi(price, RSIlength)
rsiCrossOver = ta.crossover(vrsi, RSIoverSold)
rsiCrossUnder = ta.crossunder(vrsi, RSIoverBought)
BBCrossOver = ta.crossover(source, BBlower)
BBCrossUnder = ta.crossunder(source, BBupper)
if (not na(vrsi))
if rsiCrossOver and BBCrossOver
long := true
if rsiCrossUnder and BBCrossUnder
long := false
//------------------- determine buy and sell points ---------------------
buySignall = window() and long and (not stoppedOutLong)
sellSignall = window() and (not long) and (not stoppedOutShort)
//---------- execute the strategy -----------------
if(longEntry and shortEntry)
if long
strategy.entry("LONG", strategy.long, when = buySignall, comment = "ENTER LONG")
stoppedOutLong := true
stoppedOutShort := false
else
strategy.entry("SHORT", strategy.short, when = sellSignall, comment = "ENTER SHORT")
stoppedOutLong := false
stoppedOutShort := true
else if(longEntry)
strategy.entry("LONG", strategy.long, when = buySignall)
strategy.close("LONG", when = sellSignall)
if long
stoppedOutLong := true
else
stoppedOutLong := false
else if(shortEntry)
strategy.entry("SHORT", strategy.short, when = sellSignall)
strategy.close("SHORT", when = buySignall)
if not long
stoppedOutShort := true
else
stoppedOutShort := false
//----------------- take profit and stop loss -----------------
if(tp>0.0 and sl>0.0)
if ( strategy.position_size > 0 )
strategy.exit(id="LONG", limit=longProfitPrice, stop=longStopPrice, comment="Long TP/SL Trigger")
else if ( strategy.position_size < 0 )
strategy.exit(id="SHORT", limit=shortProfitPrice, stop=shortStopPrice, comment="Short TP/SL Trigger")
else if(tp>0.0)
if ( strategy.position_size > 0 )
strategy.exit(id="LONG", limit=longProfitPrice, comment="Long TP Trigger")
else if ( strategy.position_size < 0 )
strategy.exit(id="SHORT", limit=shortProfitPrice, comment="Short TP Trigger")
else if(sl>0.0)
if ( strategy.position_size > 0 )
strategy.exit(id="LONG", stop=longStopPrice, comment="Long SL Trigger")
else if ( strategy.position_size < 0 )
strategy.exit(id="SHORT", stop=shortStopPrice, comment="Short SL Trigger")