Estrategia robótica escalable MACD MFI personalizada sin repintado
Descripción general
La estrategia es una combinación de indicadores MACD y MFI altamente personalizables y no re-mapeados, que se aplica a los robots de negociación algorítmicos. Combina indicadores de tendencia y de dinámica para generar señales de negociación a través de varios filtros.
Principio de estrategia
La estrategia utiliza el indicador MACD para determinar la dirección de la tendencia del mercado. El MACD es un indicador de movimiento de tipo de seguimiento de tendencias, se obtiene el gráfico de la columna MACD de la media móvil rápida menos la media móvil lenta, y luego se obtiene la línea de señal con la media móvil indexal del MACD.
Además, la estrategia también utiliza el indicador MFI para determinar el estado de sobreventa y sobreventa del mercado. El indicador MFI combina información sobre precios y volúmenes de transacción, y los valores oscilan entre 0 y 100. El MFI es una zona de sobreventa cuando está por debajo de 20 y una zona de sobreventa cuando está por encima de 80.
Para filtrar falsas señales, la estrategia también incluye filtros de tendencia y filtros RSI. Se genera una señal de compra cuando el precio está en una tendencia alcista y el RSI es menor que el umbral establecido.
Ventajas estratégicas
- Combinar varios indicadores para evaluar el estado del mercado y mejorar la tasa de éxito
- El sistema de filtración permite evitar señales falsas y reducir las transacciones innecesarias.
- Los diferentes parámetros y filtros se pueden configurar para adaptarse a las diferentes variedades y preferencias comerciales
- Se puede utilizar para transacciones manuales o para conectar robots algorítmicos para transacciones programadas.
Riesgos estratégicos y soluciones
La configuración incorrecta de los parámetros del indicador puede generar señales falsas
Se pueden probar diferentes parámetros para seleccionar la combinación óptima
Los parámetros de múltiples variedades no son generales y se deben probar y optimizar por separado.
La frecuencia de las transacciones puede ser excesiva, aumentando los costos de las transacciones y el riesgo de deslizamiento
Filtros ajustables para reducir la frecuencia de las transacciones
No hay que perder el control de los costos en las transacciones físicas.
Dirección de optimización de la estrategia
- Pruebas con ciclos de datos más largos para evaluar la estabilidad de los parámetros
- Intentar una combinación diferente de parámetros del indicador
- Optimizar las ponderaciones de los indicadores y mejorar la estabilidad de las estrategias
- Añadir más filtros para reducir las transacciones innecesarias
Resumir
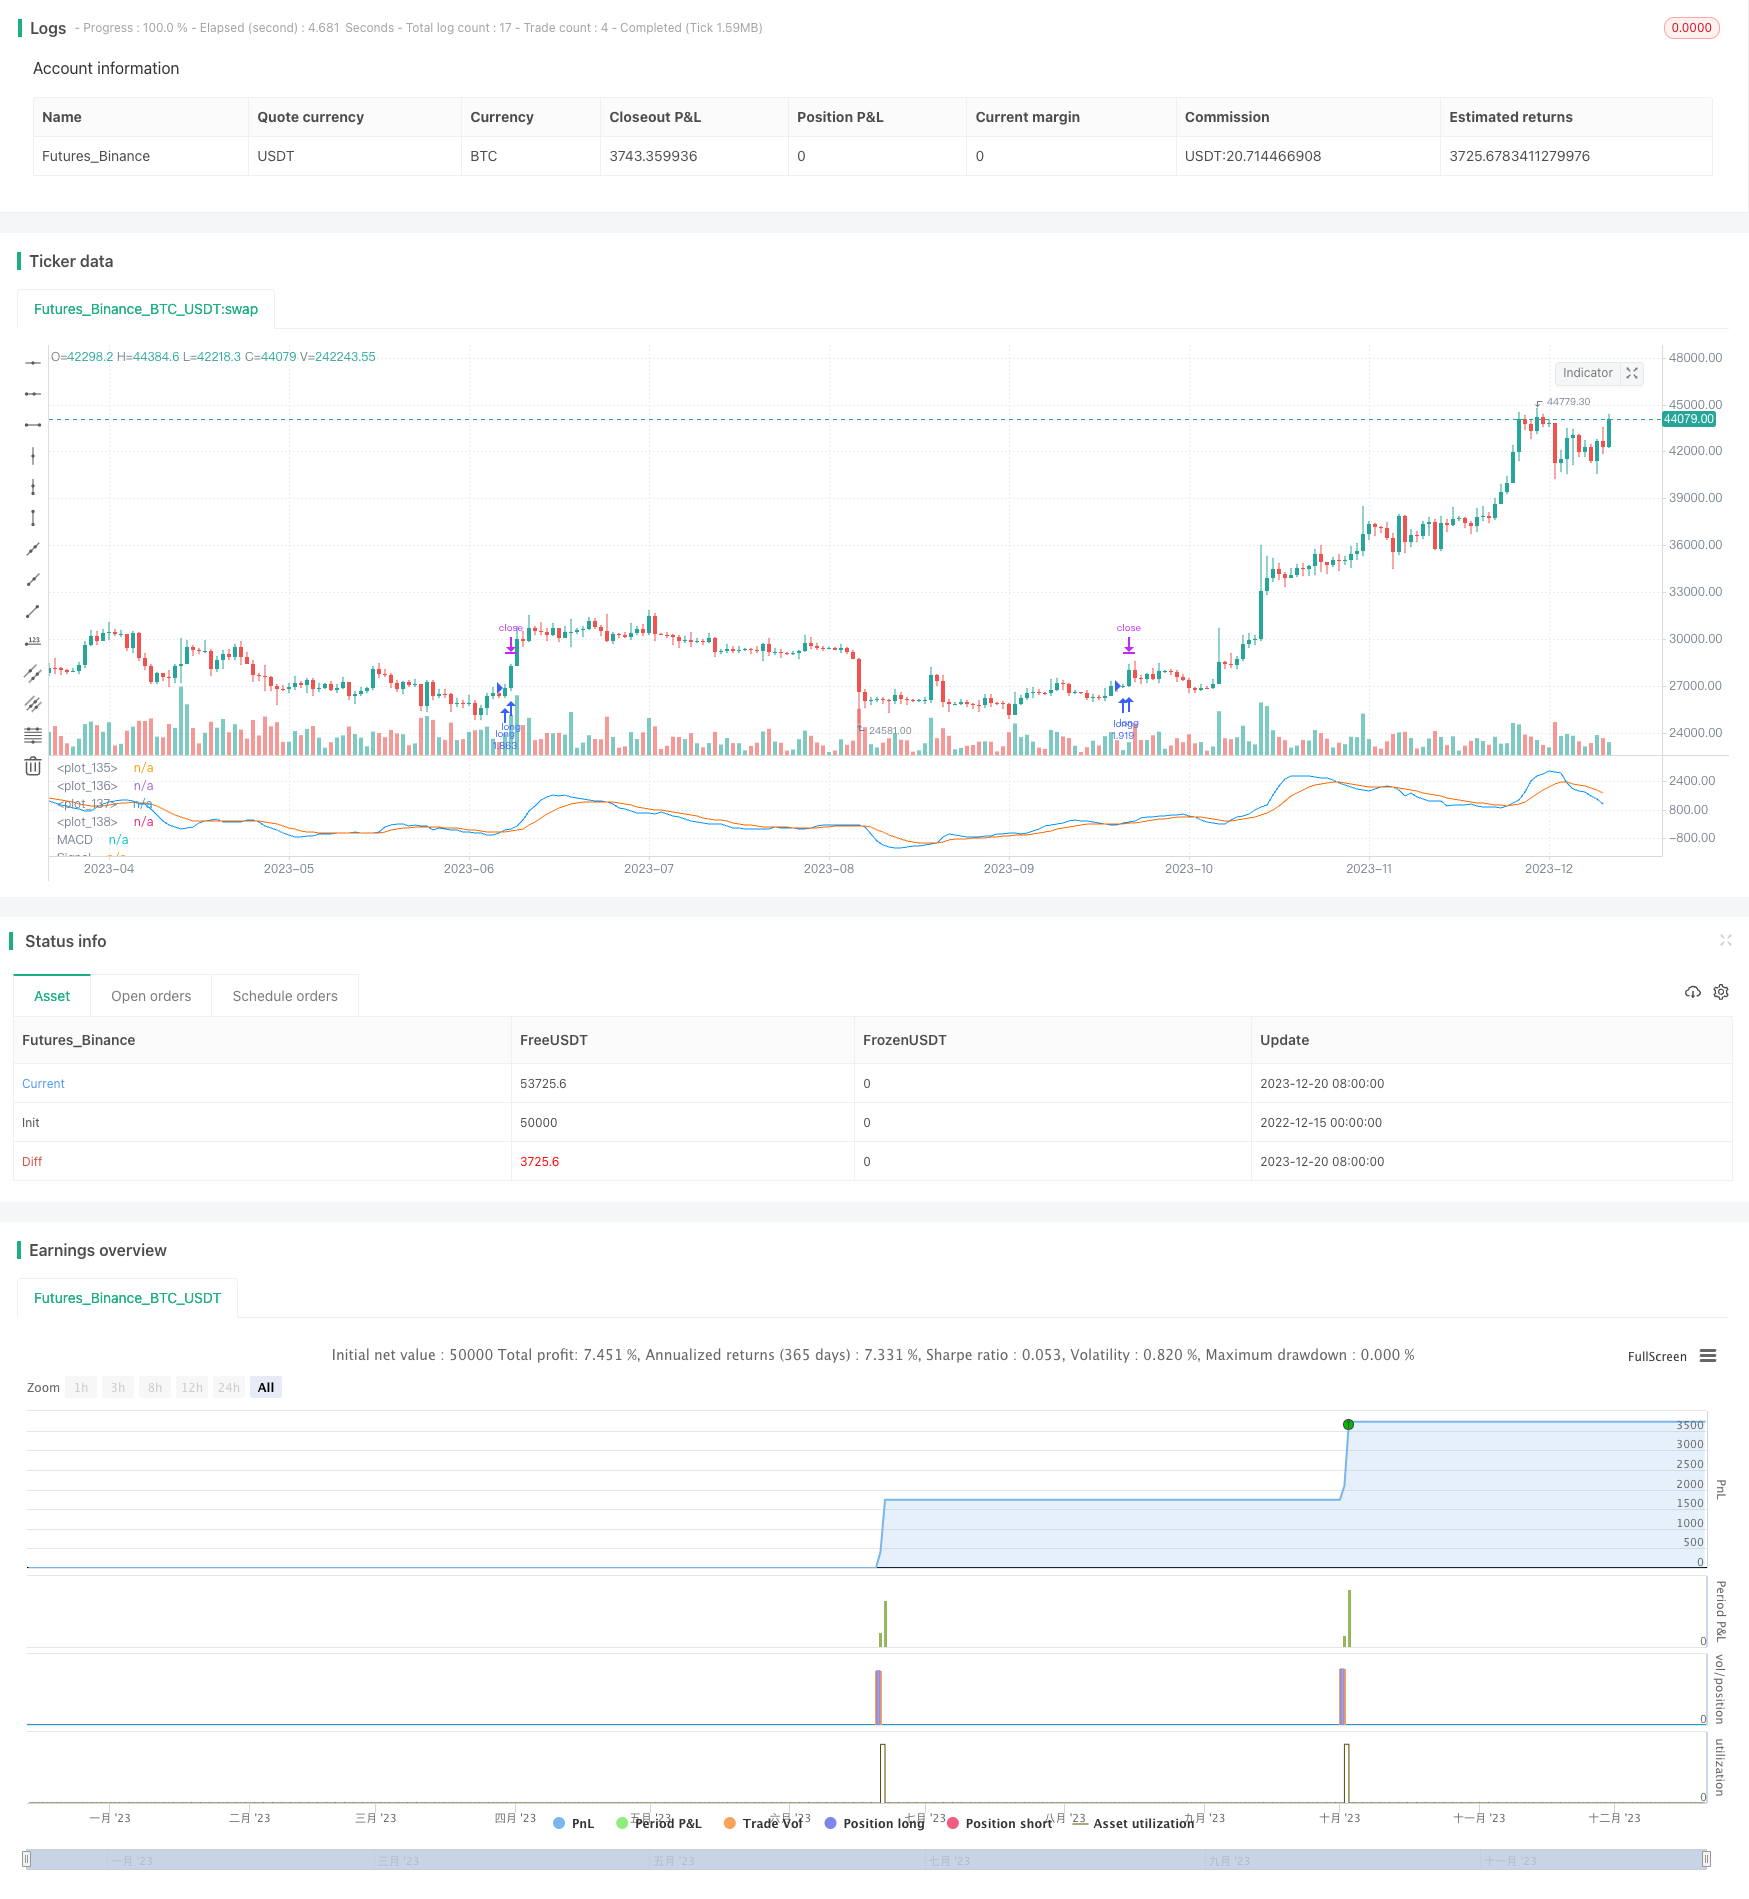
La estrategia es una estrategia de seguimiento de tendencias altamente personalizable, que combina tendencias y indicadores de dinámica para determinar el estado del mercado y utilizar eficazmente el mecanismo de filtración para controlar el riesgo. Se puede utilizar para el comercio manual, pero también se puede conectar a algoritmos robóticos para realizar operaciones programadas con un alto grado de automatización, es un sistema de estrategias que vale la pena seguir a largo plazo.
/*backtest
start: 2022-12-15 00:00:00
end: 2023-12-21 00:00:00
period: 1d
basePeriod: 1h
exchanges: [{"eid":"Futures_Binance","currency":"BTC_USDT"}]
*/

//(c) Wunderbit Trading
//Modified by Mauricio Zuniga - Trade at your own risk
//This script was originally shared on Wunderbit website as a free open source script for the community. (https://help.wundertrading.com/en/articles/5246468-macd-mfi-trading-bot-for-ftx)
//
//WHAT THIS SCRIPT DOES:
//   This is a scalping script originally intended to be used on altorightmic bot trading.
//   This strategy is based on the trend-following momentum indicator. It includes the Money Flow index as an additional point for entry.
//HOW IT DOES IT:
//   It uses a combination of MACD and MFI indicators to create entry signals.  Parameters for each indicator have been surfaced for user configurability.
//   Take profits are fixed, but stop loss uses ATR configuration to minimize losses and close profitably.
//HOW IS MY VERSION ORIGINAL:
//   I started trying to deploy this script myself in my algorithmic tradingg but ran into some issues which I have tried to address in this version.
//   Delayed Signals : The script has been refactored to use a time frame drop down.  The higher time frame can be run on a faster chart (recommended on one minute chart for fastest signal confirmation and relay to algotrading platform.
//   Repainting Issues : All indicators have been recoded to use the security function that checks to see if the current calculation is in realtime, if it is, then it uses the previous bar for calculation.
//   If you are still experiencing repainting issues based on intended (or non intended use), please provide a report with screenshot and explanation so I can try to address.
//   Filtering :  I have added to additional filters an ABOVE EMA Filter and a BELOW RSI Filter (both can be turned on and off)
//   Customizable Long and Clos Messages : This allows someone to use the script for algorithmic trading without having to alter code.  It also means you can use one indicator for all of your different alterts required for your bots.
//HOW TO USE IT:
//   Find a pair with high volatility - I have found it works particularly well with 3L and 3S tokens for crypto. although it the limitation is that confrigurations I have found to work typically have low R/R ratio, but very high win rate and profit factor.
//   Ieally set one minute chart for bots, but you can use other charts for manual trading.  The signal will be delayed by one bar but I have found configurations that still test well.
//   Select a time frame in configuration for your indicator calculations.
//   I like ot use 5 and 15 minutes for scalping scenarios, but I am interested in hearing back from other community memebers.
//   Optimize your indicator without filters (trendFilter and RSI Filter)
//   Use the TrendFilter and RSI Filter to further refine your signals for entry.

//@version=4
strategy("Customizable HTF MACD Strategy v1.2", overlay=false, pyramiding=0, commission_type=strategy.commission.percent, commission_value=0.07, default_qty_type = strategy.percent_of_equity, default_qty_value = 100, currency = currency.USD)

openlongcomment = "Comment In Here"
closelongcomment = ""
openshortcomment = ""
closeshortcommment = ""
//RES
res = input(title="Resolution", type=input.resolution, defval="5", group="Strategy", inline="1")
comment = input(title="Open Long Comment", type=input.string, defval="",group="Strategy", inline="1")

if not(comment == "")
    openlongcomment := comment
// FUNCTIONS

Ema(src,p) =>
    ema = 0.
    sf = 2/(p+1)
    ema := nz(ema[1] + sf*(src - ema[1]),src)

Sma(src,p) => a = cum(src), (a - a[max(p,0)])/max(p,0)

Atr(p, res) =>
    atr = 0.
    highHTF = security(syminfo.tickerid, res, high[barstate.isrealtime ? 1 : 0])
    lowHTF = security(syminfo.tickerid, res, low[barstate.isrealtime ? 1 : 0])
    closeHTF = security(syminfo.tickerid, res, close[barstate.isrealtime ? 1 : 0])
    Tr = max(highHTF - lowHTF, max(abs(highHTF - closeHTF[1]), abs(lowHTF - closeHTF[1])))
    atr := nz(atr[1] + (Tr - atr[1])/p,Tr)


ribbon_period = input(39, "Period", step=1)

htfClose = security(syminfo.tickerid, res, close[barstate.isrealtime ? 1 : 0])

leadLine1 = ema(htfClose, ribbon_period)
leadLine2 = sma(htfClose, ribbon_period)

// p3 = plot(leadLine1, color= #53b987, title="EMA", transp = 50, linewidth = 1)
// p4 = plot(leadLine2, color= #eb4d5c, title="SMA", transp = 50, linewidth = 1)
// fill(p3, p4, transp = 60, color = leadLine1 > leadLine2 ? #53b987 : #eb4d5c)

//Upward Trend
UT=leadLine2 < leadLine1
DT=leadLine2>leadLine1
//FILTER LOGIC
aboveTrend = input(true, title="Use Trend", group="Filters", inline='1', type=input.bool)
TrendLength  = input(3, minval=1, title="Trend MA", group="Filters", inline='1', type=input.integer)
aboveTrendFilter = sma(htfClose,TrendLength)

useRSI = input(true, title="Use RSI", group="Filters", inline='2', type=input.bool)
RSILength  = input(34, minval=1, title="RSI Length", group="Filters", inline='2') // used to calculate RSI
belowRSIFilter  = input(50, minval=1, title="Buy Below RSI Filter", group="Filters", inline='2') // only buy if its below this RSI - doesn't seem to work as expected
rsi = rsi(htfClose,RSILength)

if not(useRSI)
    belowRSIFilter = 100
if not(aboveTrend)
    aboveTrendFilter = -1


// MACD
fast_length = input(title="Fast Length", type=input.integer, defval=7)
slow_length = input(title="Slow Length", type=input.integer, defval=23)
src = input(title="Source", type=input.source, defval=close)
signal_length = input(title="Signal Smoothing", type=input.integer, minval = 1, maxval = 50, defval = 10)
sma_source = input(title="Simple MA(Oscillator)", type=input.bool, defval=false)
sma_signal = input(title="Simple MA(Signal Line)", type=input.bool, defval=false)

// Plot colors
col_grow_above = #26A69A
col_grow_below = #FFCDD2
col_fall_above = #B2DFDB
col_fall_below = #EF5350
col_macd = #0094ff
col_signal = #ff6a00


srcHTF = security(syminfo.tickerid, res, src[barstate.isrealtime ? 1 : 0])
// Calculating
fast_ma = sma_source ? Sma(srcHTF, fast_length) : Ema(srcHTF, fast_length)
slow_ma = sma_source ? Sma(srcHTF, slow_length) : Ema(srcHTF, slow_length)

macd = fast_ma - slow_ma
signal = sma_signal ? Sma(macd, signal_length) : Ema(macd, signal_length)
hist = macd - signal

//plot(hist, title="Histogram", style=plot.style_columns, color=(hist>=0 ? (hist[1] < hist ? col_grow_above : col_fall_above) : (hist[1] < hist ? col_grow_below : col_fall_below) ), transp=0 )
plot(macd, title="MACD", color=col_macd, transp=0)
plot(signal, title="Signal", color=col_signal, transp=0)

/// MFI

MFIsource = hlc3
sourceHTF = security(syminfo.tickerid, res, MFIsource[barstate.isrealtime ? 1 : 0])
length = input(15, minval=1)
lower = input(12, minval=0, maxval=50)
upper = input(80, minval=50, maxval=100)

// DrawMFI_f=input(true, title="Draw MFI?", type=bool)
HighlightBreaches=input(true, title="Highlight Oversold/Overbought?")

volumeHTF = security(syminfo.tickerid, res, volume[barstate.isrealtime ? 1 : 0])

// MFI
upper_s = sum(volumeHTF * (change(sourceHTF) <= 0 ? 0 : sourceHTF), length)
lower_s = sum(volumeHTF * (change(sourceHTF) >= 0 ? 0 : sourceHTF), length)
mf = rsi(upper_s, lower_s)
mfp = plot(mf, color=color.new(color.gray,0), linewidth=1)
top = hline(upper, color=color.new(color.gray, 100), linewidth=1, editable=false)
bottom = hline(lower, color=color.new(color.gray,100), linewidth=1, editable=false)
hline(0, color=color.new(color.black,100), editable=false)
hline(100, color=color.new(color.black,100), editable=false)

// Breaches
b_color = (mf > upper) ? color.new(color.red,70) : (mf < lower) ? color.new(color.green,60) : na
bgcolor(HighlightBreaches ? b_color : na)

fill(top, bottom, color=color.gray, transp=75)

// TAKE PROFIT AND STOP LOSS
long_tp1_inp = input(1, title='Long Take Profit 1 %', step=0.1)/100
long_tp1_qty = input(20, title="Long Take Profit 1 Qty", step=1)

long_trailing = input(1.3, title='Trailing Stop Long', step=0.1) / 100

long_take_level_1 = strategy.position_avg_price * (1 + long_tp1_inp)

// Stop Loss
multiplier = input(2, "SL Mutiplier", minval=1, step=0.1)
ATR_period=input(40,"ATR period", minval=1, step=1)

// Strategy
entry_long=(crossover(macd,signal) or (crossover(mf,lower) and leadLine2 < leadLine1)) and rsi < belowRSIFilter and close > aboveTrendFilter
entry_price_long=valuewhen(entry_long,close,0)
//SL_floating_long = entry_price_long -( (entry_price_long)*multiplier/100)//*Atr(ATR_period,res)
//SL_floating_long = entry_price_long - multiplier*Atr(ATR_period,res)
SL_floating_long = entry_price_long - multiplier*Atr(ATR_period,res)
exit_long= close < SL_floating_long

///// BACKTEST PERIOD ///////
testStartYear = input(2018, "Backtest Start Year")
testStartMonth = input(1, "Backtest Start Month")
testStartDay = input(1, "Backtest Start Day")
testPeriodStart = timestamp(testStartYear, testStartMonth, testStartDay, 0, 0)

testStopYear = input(9999, "Backtest Stop Year")
testStopMonth = input(12, "Backtest Stop Month")
testStopDay = input(31, "Backtest Stop Day")
testPeriodStop = timestamp(testStopYear, testStopMonth, testStopDay, 0, 0)

testPeriod() =>
    time >= testPeriodStart and time <= testPeriodStop ? true : false

if testPeriod()
    if UT
        strategy.entry("long", strategy.long, when=entry_long == true, comment=openlongcomment)
    strategy.exit("TP1","long", qty_percent=long_tp1_qty, limit=long_take_level_1)
    strategy.exit("Trail stop","long",  comment=closelongcomment,  trail_points=entry_price_long * long_trailing / syminfo.mintick, trail_offset=entry_price_long * long_trailing / syminfo.mintick)
    strategy.close("long", exit_long == true,  comment=closelongcomment )