Estrategia de transformación del índice oscilador
Descripción general
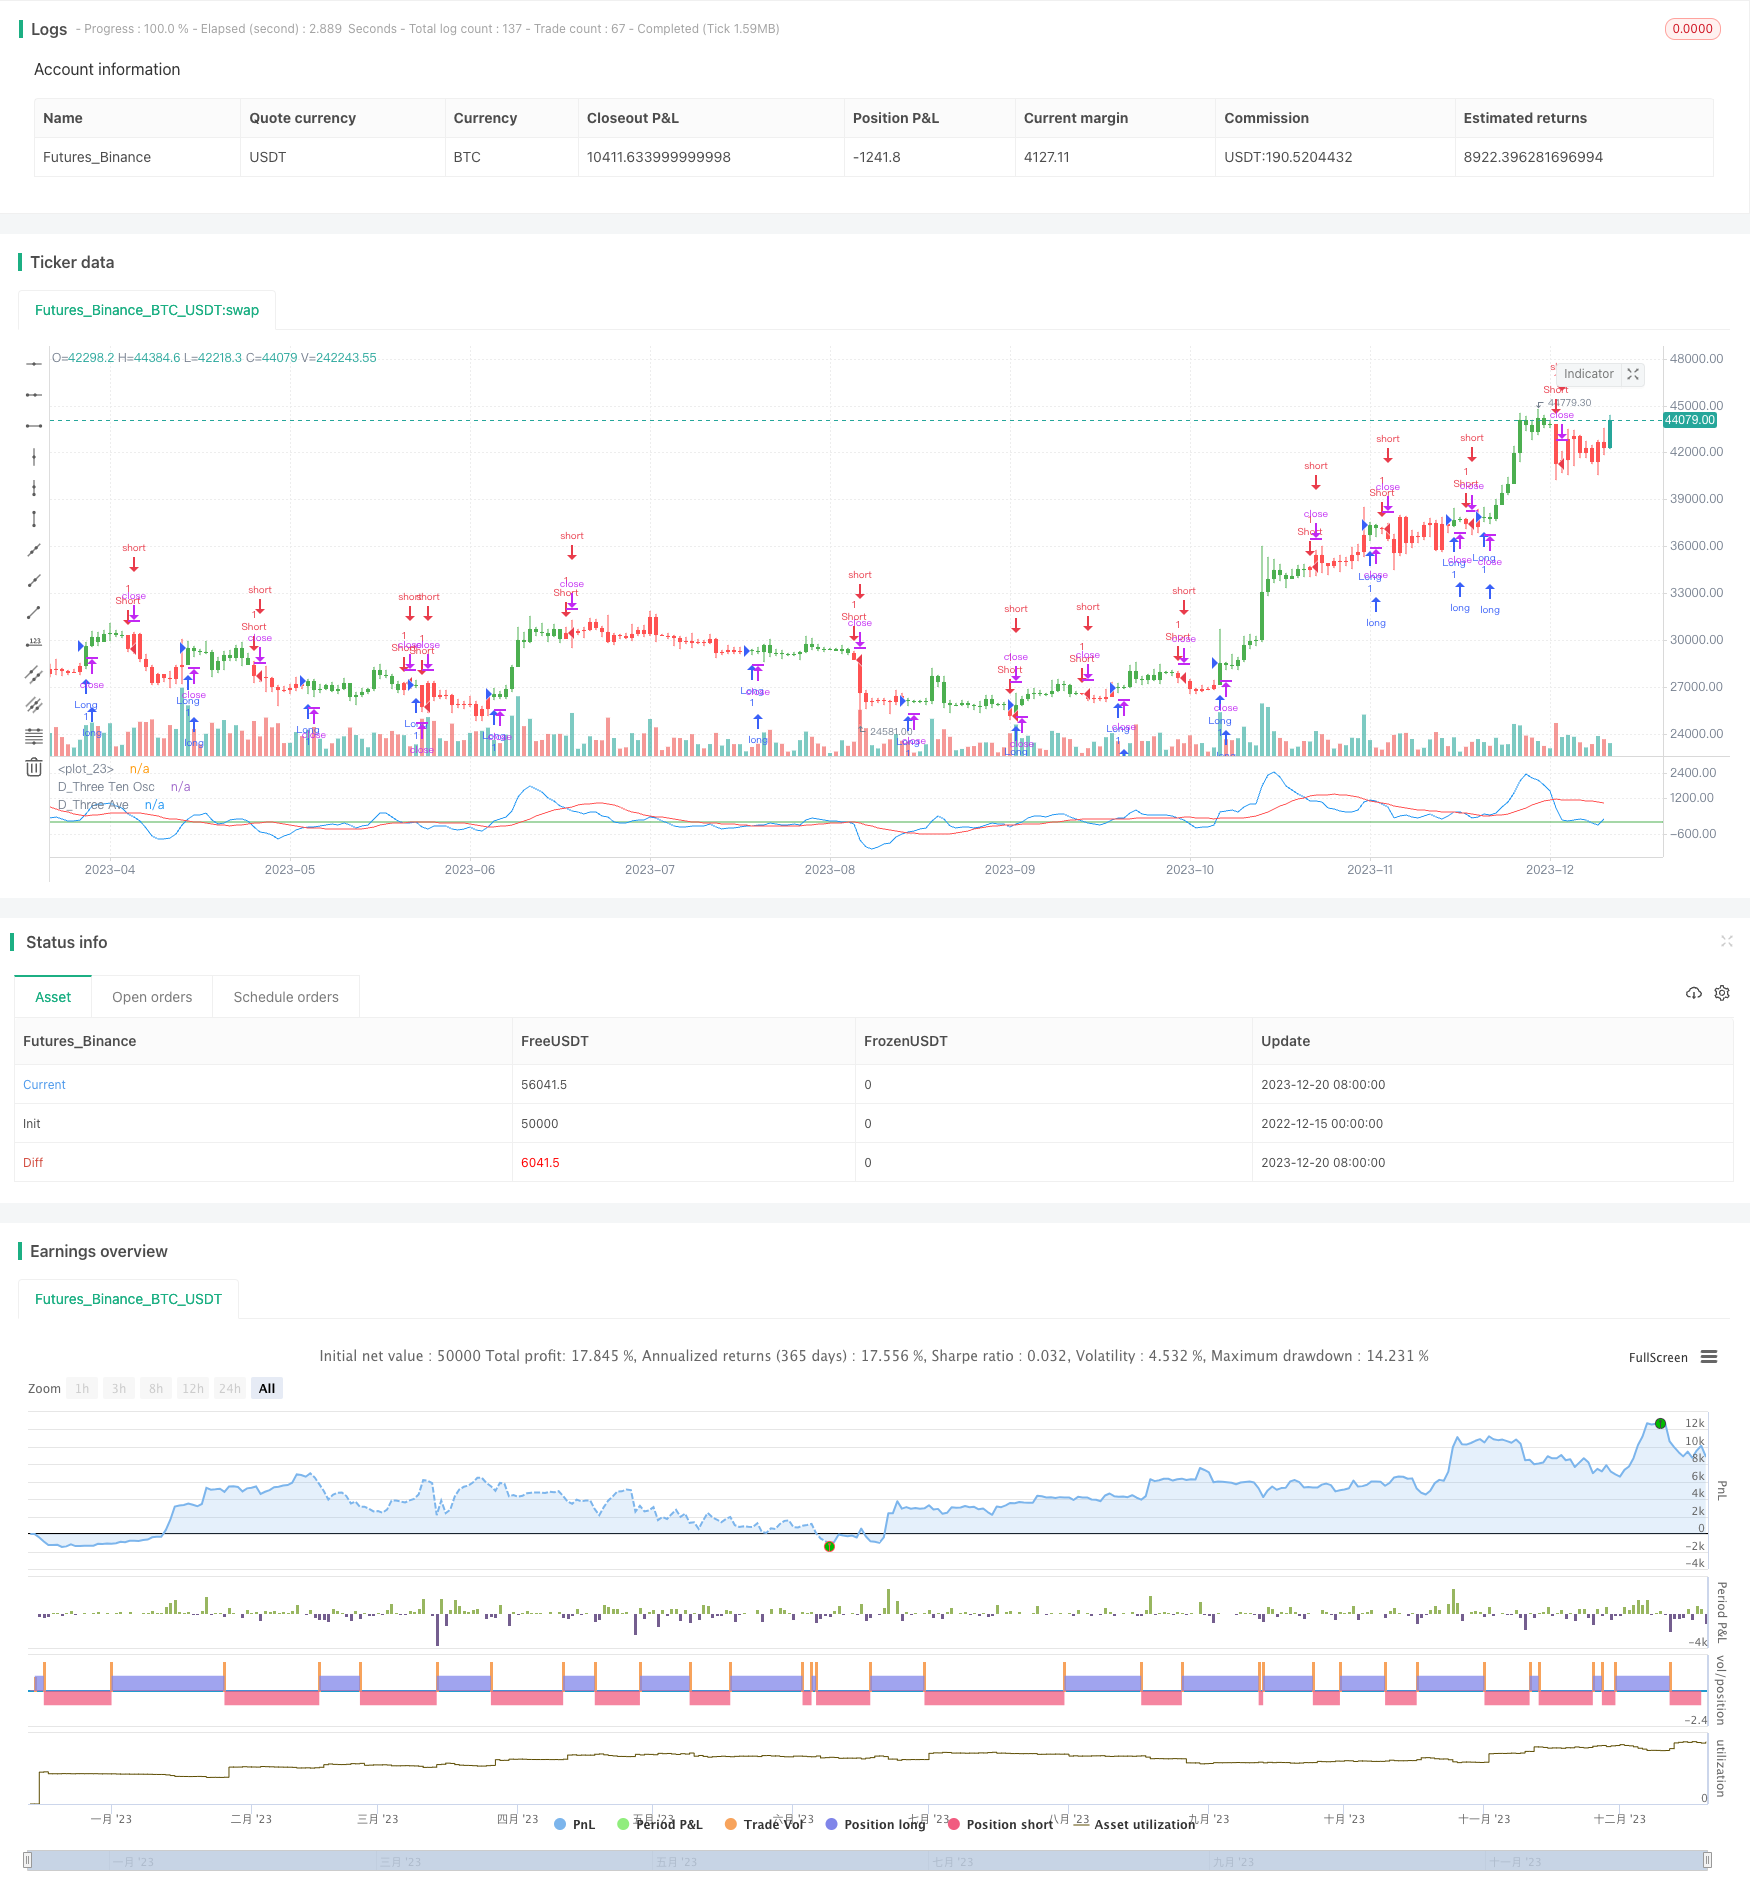
La estrategia de transformación del índice oscilante utiliza el cruce entre el índice oscilante 3-10 de Bressert y su promedio móvil simple de 16 días para generar una señal de negociación. La estrategia se aplica tanto para el día como para la noche.
Principio de estrategia
La estrategia se basa en el índice de oscilación 3-10 de Bressert, que es el diferencial entre el promedio móvil de 3 días y el promedio móvil de 10 días.
Concretamente, la estrategia primero calcula el EMA de 3 días, el EMA de 10 días y sus diferencias como índice de oscilación. Luego calcula el promedio móvil simple del índice de oscilación de 16 días como línea de señal.
Análisis de las ventajas
- El uso del clásico índice de oscilación de Bressert tiene cierto efecto.
- La combinación de las líneas rápidas y lentas se cruzan para formar señales de transacción, lo que facilita la determinación de las entradas y salidas
- Permitir un enfoque inverso que se adapte a las diferentes circunstancias del mercado
- Se puede utilizar en operaciones diurnas y nocturnas
Análisis de riesgos
- El efecto de la oscilación del Bretherton es inestable, y hay cierta volatilidad de ganancias y pérdidas.
- Las señales de cruce de línea rápida y lenta pueden presentar falsas señales
- La inversión es arriesgada y requiere precaución
- Las operaciones diurnas deben tener en cuenta la estrategia de stop loss y las operaciones nocturnas deben tener en cuenta la administración de fondos
Dirección de optimización
- Optimización de parámetros, ajuste de la media móvil y búsqueda de la mejor combinación de parámetros
- Aumentar las condiciones de filtración para determinar la calidad de la señal en combinación con otros indicadores o formas de precio
- Incrementar las estrategias de stop loss, establecer puntos de stop loss razonables y controlar las pérdidas individuales
- Optimizar la gestión de fondos, ajustar el tamaño de las posiciones y reducir el impacto de las pérdidas individuales en el capital total
Resumir
La estrategia de cambio de índice de oscilación es una estrategia de negociación en línea corta, que genera una señal de negociación mediante el cruce del índice de oscilación 3-10 de Bressert y su línea de señal. Es sencilla y práctica. La estrategia puede aplicarse en operaciones diurnas y nocturnas, pero existe un cierto riesgo de fluctuación de pérdidas y falsas señales.
/*backtest
start: 2022-12-15 00:00:00
end: 2023-12-21 00:00:00
period: 1d
basePeriod: 1h
exchanges: [{"eid":"Futures_Binance","currency":"BTC_USDT"}]
*/

//@version=2
////////////////////////////////////////////////////////////
//  Copyright by HPotter v1.0 27/03/2017
// TradeStation does not allow the user to make a Multi Data Chart with
// a Tick Bar Chart and any other type a chart. This indicator allows the
// user to plot a daily 3-10 Oscillator on a Tick Bar Chart or any intraday interval.
// Walter Bressert's 3-10 Oscillator is a detrending oscillator derived
// from subtracting a 10 day moving average from a 3 day moving average.
// The second plot is an 16 day simple moving average of the 3-10 Oscillator.
// The 16 period moving average is the slow line and the 3/10 oscillator is
// the fast line.
// For more information on the 3-10 Oscillator see Walter Bressert's book
// "The Power of Oscillator/Cycle Combinations"
//
// You can change long to short in the Input Settings
// Please, use it only for learning or paper trading. Do not for real trading.
////////////////////////////////////////////////////////////
strategy(title="D_Three Ten Osc", shorttitle="D_Three Ten Osc")
Length1 = input(3, minval=1)
Length2 = input(10, minval=1)
Length3 = input(16, minval=1)
reverse = input(false, title="Trade reverse")
hline(0, color=green, linestyle=line)
xPrice =  request.security(syminfo.tickerid,"D", hl2)
xfastMA = ema(xPrice, Length1)
xslowMA = ema(xPrice, Length2)
xMACD = xfastMA - xslowMA
xSignal = sma(xMACD, Length3)
pos = iff(xSignal > xMACD, -1,
	     iff(xSignal < xMACD, 1, nz(pos[1], 0)))
possig = iff(reverse and pos == 1, -1,
          iff(reverse and pos == -1, 1, pos))
if (possig == 1)
    strategy.entry("Long", strategy.long)
if (possig == -1)
    strategy.entry("Short", strategy.short)
barcolor(possig == -1 ? red: possig == 1 ? green : blue )
plot(request.security(syminfo.tickerid, "D", xMACD), color=blue, title="D_Three Ten Osc")
plot(request.security(syminfo.tickerid, "D", xSignal), color=red, title="D_Three Ave")