Estrategia de negociación de media móvil de Heinach basada en percentiles
Descripción general
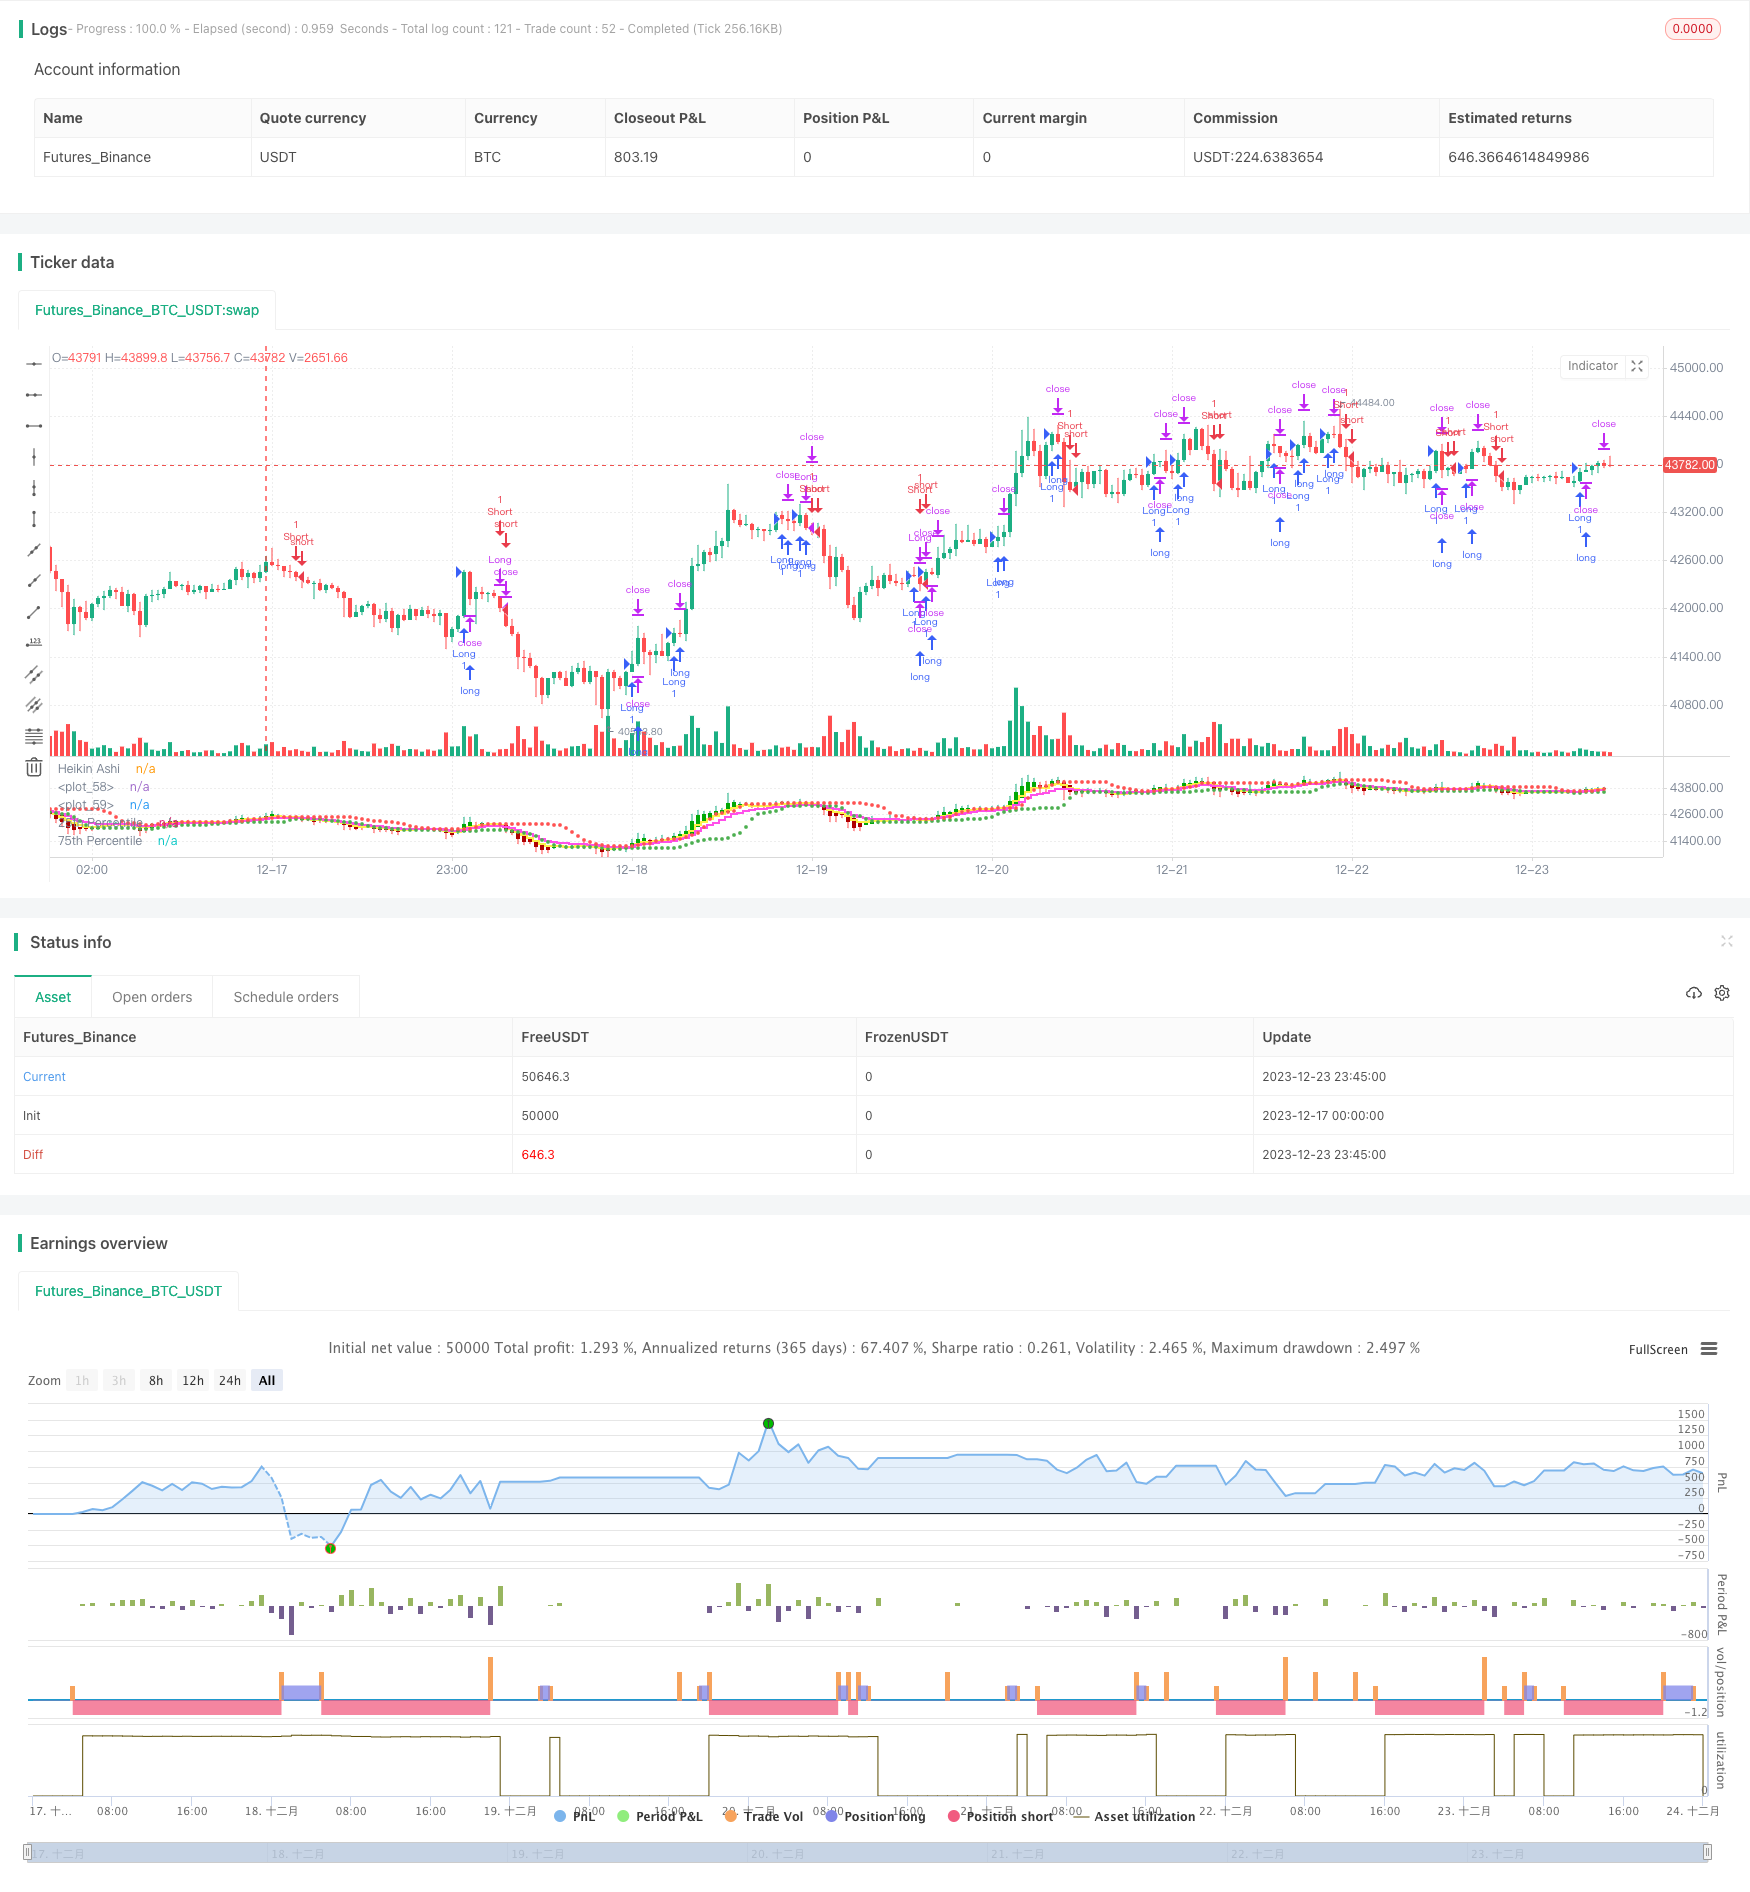
La estrategia se basa en la generación de señales de negociación en la línea media de Heinrich. La generación de señales de compra y venta tiene en cuenta el cruce entre el precio de cierre de Heinrich y el nivel de precios del 75 por ciento y el precio de cierre de Heinrich por encima de la media móvil.
Principio de estrategia
La estrategia utiliza la línea de Heinrich Himmler para su análisis en lugar de la línea K ordinaria, que filtra el ruido del mercado y es más útil para detectar tendencias y señales de reversión. En concreto, la estrategia combina canales porcentuales y medias móviles para generar señales de negociación:
- La señal de compra se produce cuando el precio de cierre de Hines se cruza por el 75 por ciento.
- Una señal de venta se genera cuando Hayashi cruza la media móvil de 5 días por debajo del precio de cierre.
Además, la estrategia también establece la distancia de parada y el seguimiento de la parada para controlar el riesgo unilateral.
Ventajas estratégicas
- El uso de la línea media de Heinrich Himmler permite identificar las tendencias con mayor claridad y detectar las señales de reversión a tiempo.
- En combinación con el canal de porcentaje, se puede determinar si el precio está en un estado de sobre-calentamiento o de sobreventa, para así determinar el momento de comprar y vender.
- La configuración de stop loss y el seguimiento del stop loss ayudan a controlar el riesgo de forma activa y evitar pérdidas que excedan lo que se puede soportar.
Riesgo estratégico
- La línea media de Heinrich Himmler puede generar un retraso en sí misma y puede perderse el punto óptimo para la operación de la línea corta.
- El canal porcentual no puede determinar completamente el punto de inflexión del precio, existe una cierta tasa de falsa señal.
- El ajuste incorrecto de la distancia de parada puede ser demasiado flexible o demasiado apretado, lo que afecta el rendimiento de la estrategia.
Para reducir los riesgos mencionados anteriormente, se puede ajustar adecuadamente el ciclo de la media móvil o ajustar la proporción de stop loss, etc.
Optimización de la estrategia
- Prueba diferentes combinaciones de medias móviles para encontrar el mejor parámetro.
- Prueba de diferentes parámetros de canal porcentual para asegurar la captura de la zona de calor de los precios.
- En combinación con otros indicadores para verificar las señales de compra y venta y filtrar las falsas señales.
- Ajuste dinámico de la distancia de frenado.
Resumir
Esta estrategia integra varios indicadores como la línea media de Heinrich, el canal porcentual y el promedio móvil para formar un sistema de negociación. El sistema puede identificar la dirección de la tendencia de manera eficiente y establecer un stop loss para controlar el riesgo, es una estrategia de negociación cuantitativa que vale la pena considerar. Se espera que la estabilidad del sistema sea mejorada aún más mediante la optimización de los parámetros y la adición de otros indicadores auxiliares.
/*backtest
start: 2023-12-17 00:00:00
end: 2023-12-24 00:00:00
period: 45m
basePeriod: 5m
exchanges: [{"eid":"Futures_Binance","currency":"BTC_USDT"}]
*/

//@version=5
strategy("HK Percentile Interpolation One",shorttitle = "HKPIO", overlay=false, default_qty_type = strategy.cash, default_qty_value = 5000, calc_on_order_fills = true, calc_on_every_tick = true)

// Input parameters
stopLossPercentage = input(3, title="Stop Loss (%)") // User can set Stop Loss as a percentage
trailStopPercentage = input(1.5, title="Trailing Stop (%)") // User can set Trailing Stop as a percentage
lookback = input.int(14, title="Lookback Period", minval=1) // User can set the lookback period for percentile calculation
yellowLine_length = input.int(5, "Yellow", minval=1) // User can set the length for Yellow EMA
purplLine_length = input.int(10, "Purple", minval=1) // User can set the length for Purple EMA
holdPeriod = input.int(200, title="Minimum Holding Period", minval=10) // User can set the minimum holding period
startDate = timestamp("2021 01 01")  // User can set the start date for the strategy

// Calculate Heikin Ashi values
haClose = ohlc4
var float haOpen = na
haOpen := na(haOpen[1]) ? (open + close) / 2 : (haOpen[1] + haClose[1]) / 2
haHigh = math.max(nz(haOpen, high), nz(haClose, high), high)
haLow = math.min(nz(haOpen, low), nz(haClose, low), low)

// Calculate Moving Averages
yellowLine = ta.ema(haClose, yellowLine_length)
purplLine = ta.ema(haClose, purplLine_length)

// Calculate 25th and 75th percentiles
p25 = ta.percentile_linear_interpolation(haClose, lookback, 28)
p75 = ta.percentile_linear_interpolation(haClose, lookback, 78)

// Generate buy/sell signals
longSignal = ta.crossover(haClose, p75) and haClose > yellowLine
sellSignal = ta.crossunder(haClose, yellowLine)
longSignal1 = ta.crossover(haClose, p75) and haClose > purplLine
sellSignal1 = ta.crossunder(haClose, purplLine)

// Set start time and trade conditions
if(time >= startDate)
    // When longSignal is true, enter a long trade and set stop loss and trailing stop conditions
    if (longSignal)
        strategy.entry("Long", strategy.long, 1)
        strategy.exit("Sell", "Long", stop=close*(1-stopLossPercentage/100), trail_points=close*trailStopPercentage/100, trail_offset=close*trailStopPercentage/100)
    // When sellSignal is true, close the long trade
    if (sellSignal)
        strategy.close("Long")
    // When sellSignal1 is true, enter a short trade
    if (sellSignal1)
        strategy.entry("Short", strategy.short, 1)
    // When longSignal1 is true, close the short trade
    if (longSignal1)
        strategy.close("Short")

// Plot Heikin Ashi candles
plotcandle(haOpen, haHigh, haLow, haClose, title="Heikin Ashi", color=(haClose >= haOpen ? color.rgb(1, 168, 6) : color.rgb(176, 0, 0)))

// Plot 25th and 75th percentile levels
plot(p25, title="25th Percentile", color=color.green, linewidth=1, style=plot.style_circles)
plot(p75, title="75th Percentile", color=color.red, linewidth=1, style=plot.style_circles)

// Plot Moving Averages
plot(yellowLine, color = color.rgb(254, 242, 73, 2), linewidth = 2, style = plot.style_stepline)
plot(purplLine, color = color.rgb(255, 77, 234, 2), linewidth = 2, style = plot.style_stepline)