Estrategia de seguimiento de tendencias basada en RSI y media móvil ponderada
Descripción general
Esta estrategia se basa en dos indicadores famosos: el indicador de fuerza relativa (RSI) y el promedio móvil ponderado (WMA), para identificar las tendencias del mercado y seguir su dirección. El RSI se utiliza para determinar la sobrecompra y la sobreventa, y el WMA se utiliza para determinar la tendencia de los precios, que en combinación pueden filtrar eficazmente las señales no relacionadas y aumentar la probabilidad de obtener ganancias.
Principio de estrategia
Indicadores de la RSI
El RSI es uno de los indicadores más conocidos de sobrecompra y sobreventa. Su fórmula es:
\[RSI = 100 - \frac{100}{1+\frac{AvgGain}{AvgLoss}}\]
donde AvgGain es la suma de los precios de cierre por el número de días en un período determinado en que el precio de cierre es superior al precio de apertura, dividido por el número de días, y AvgLoss es la suma de los valores absolutos de los precios de cierre por el número de días en que el precio de cierre es inferior al precio de apertura, dividido por el número de días.
Esta estrategia establece el ciclo RSI a 20 como indicador para juzgar la tendencia. Cuando el RSI es mayor que 60 produce una señal de más de una cabeza y cuando es menor que 40 produce una señal de cabeza vacía.
Promedio móvil ponderado WMA
El WMA es más intenso que el SMA para ajustar los precios recientes. Su fórmula de cálculo es:
\[WMA = \frac{\sum_{i=1}^n w_i x_i}{\sum_{i=1}^n w_i}\]
w es el peso, y crece exponencialmente a medida que aumenta i. La fórmula de peso utilizada en esta estrategia es:
\[w = \begin{cases} 100/(4+(n-4)*1.3), & i <= 3 \ 1.3*w, & i > 3 \end{cases}\]
Es decir, el peso de los últimos 3 días es el mismo, luego el peso de cada día anterior aumenta 1.3 veces. Esto puede resaltar el impacto de los precios recientes.
En esta estrategia, la WMA tiene una duración de 20 días.
Señales de estrategia
Señales múltiples: RSI > 60 y WMA 20 días ROC < -1
Señales de cabeza hueca: RSI < 40 y WMA 20 días ROC > 1
La fórmula para calcular el ROC de 20 días de WMA es:
Entonces, si lo que hacemos es decir que $\(ROC = (WMA_{hoy}/WMA_{hace 20 días} - 1) \times 100\)$
Ventajas estratégicas
- Utilice el RSI para determinar la dirección de la tendencia y evitar el agotamiento de su capital por el movimiento de los mercados
- La WMA analiza las principales tendencias en la reducción del ruido a través de la ponderación reciente
- El uso de RSI y WMA ROC en combinación puede filtrar eficazmente las señales no relacionadas
- Con el uso de múltiples ATRs de paradas aleatorias, el seguimiento de las paradas permite un bloqueo flexible de las ganancias
- El método de gestión de fondos permite ajustar el tamaño de las posiciones en función de las ganancias y pérdidas y controlar el riesgo
Riesgo estratégico
- Los parámetros de la estrategia incorrectos pueden conducir a la frecuencia de las transacciones, se recomienda optimizar los parámetros
- La configuración incorrecta de los puntos de parada puede aumentar las pérdidas
- Como una estrategia de seguimiento de tendencias, no es adecuado para los mercados de liquidación convulsivos
- Atención a los cambios en el entorno macroeconómico y compensación manual si es necesario
Dirección de optimización de la estrategia
- Prueba la longitud del RSI, la longitud del WMA y el umbral del ROC para encontrar la combinación óptima de parámetros
- Prueba diferentes métodos de gestión de fondos para encontrar el mejor plan de ajuste de posición
- El objetivo de la investigación es analizar el impacto de las nuevas tecnologías en la salud y la salud pública.
- La combinación de estrategias de stop loss para reducir el riesgo de pérdidas individuales
- Optimización de la estrategia de frenado para maximizar las ganancias en la tendencia
Resumir
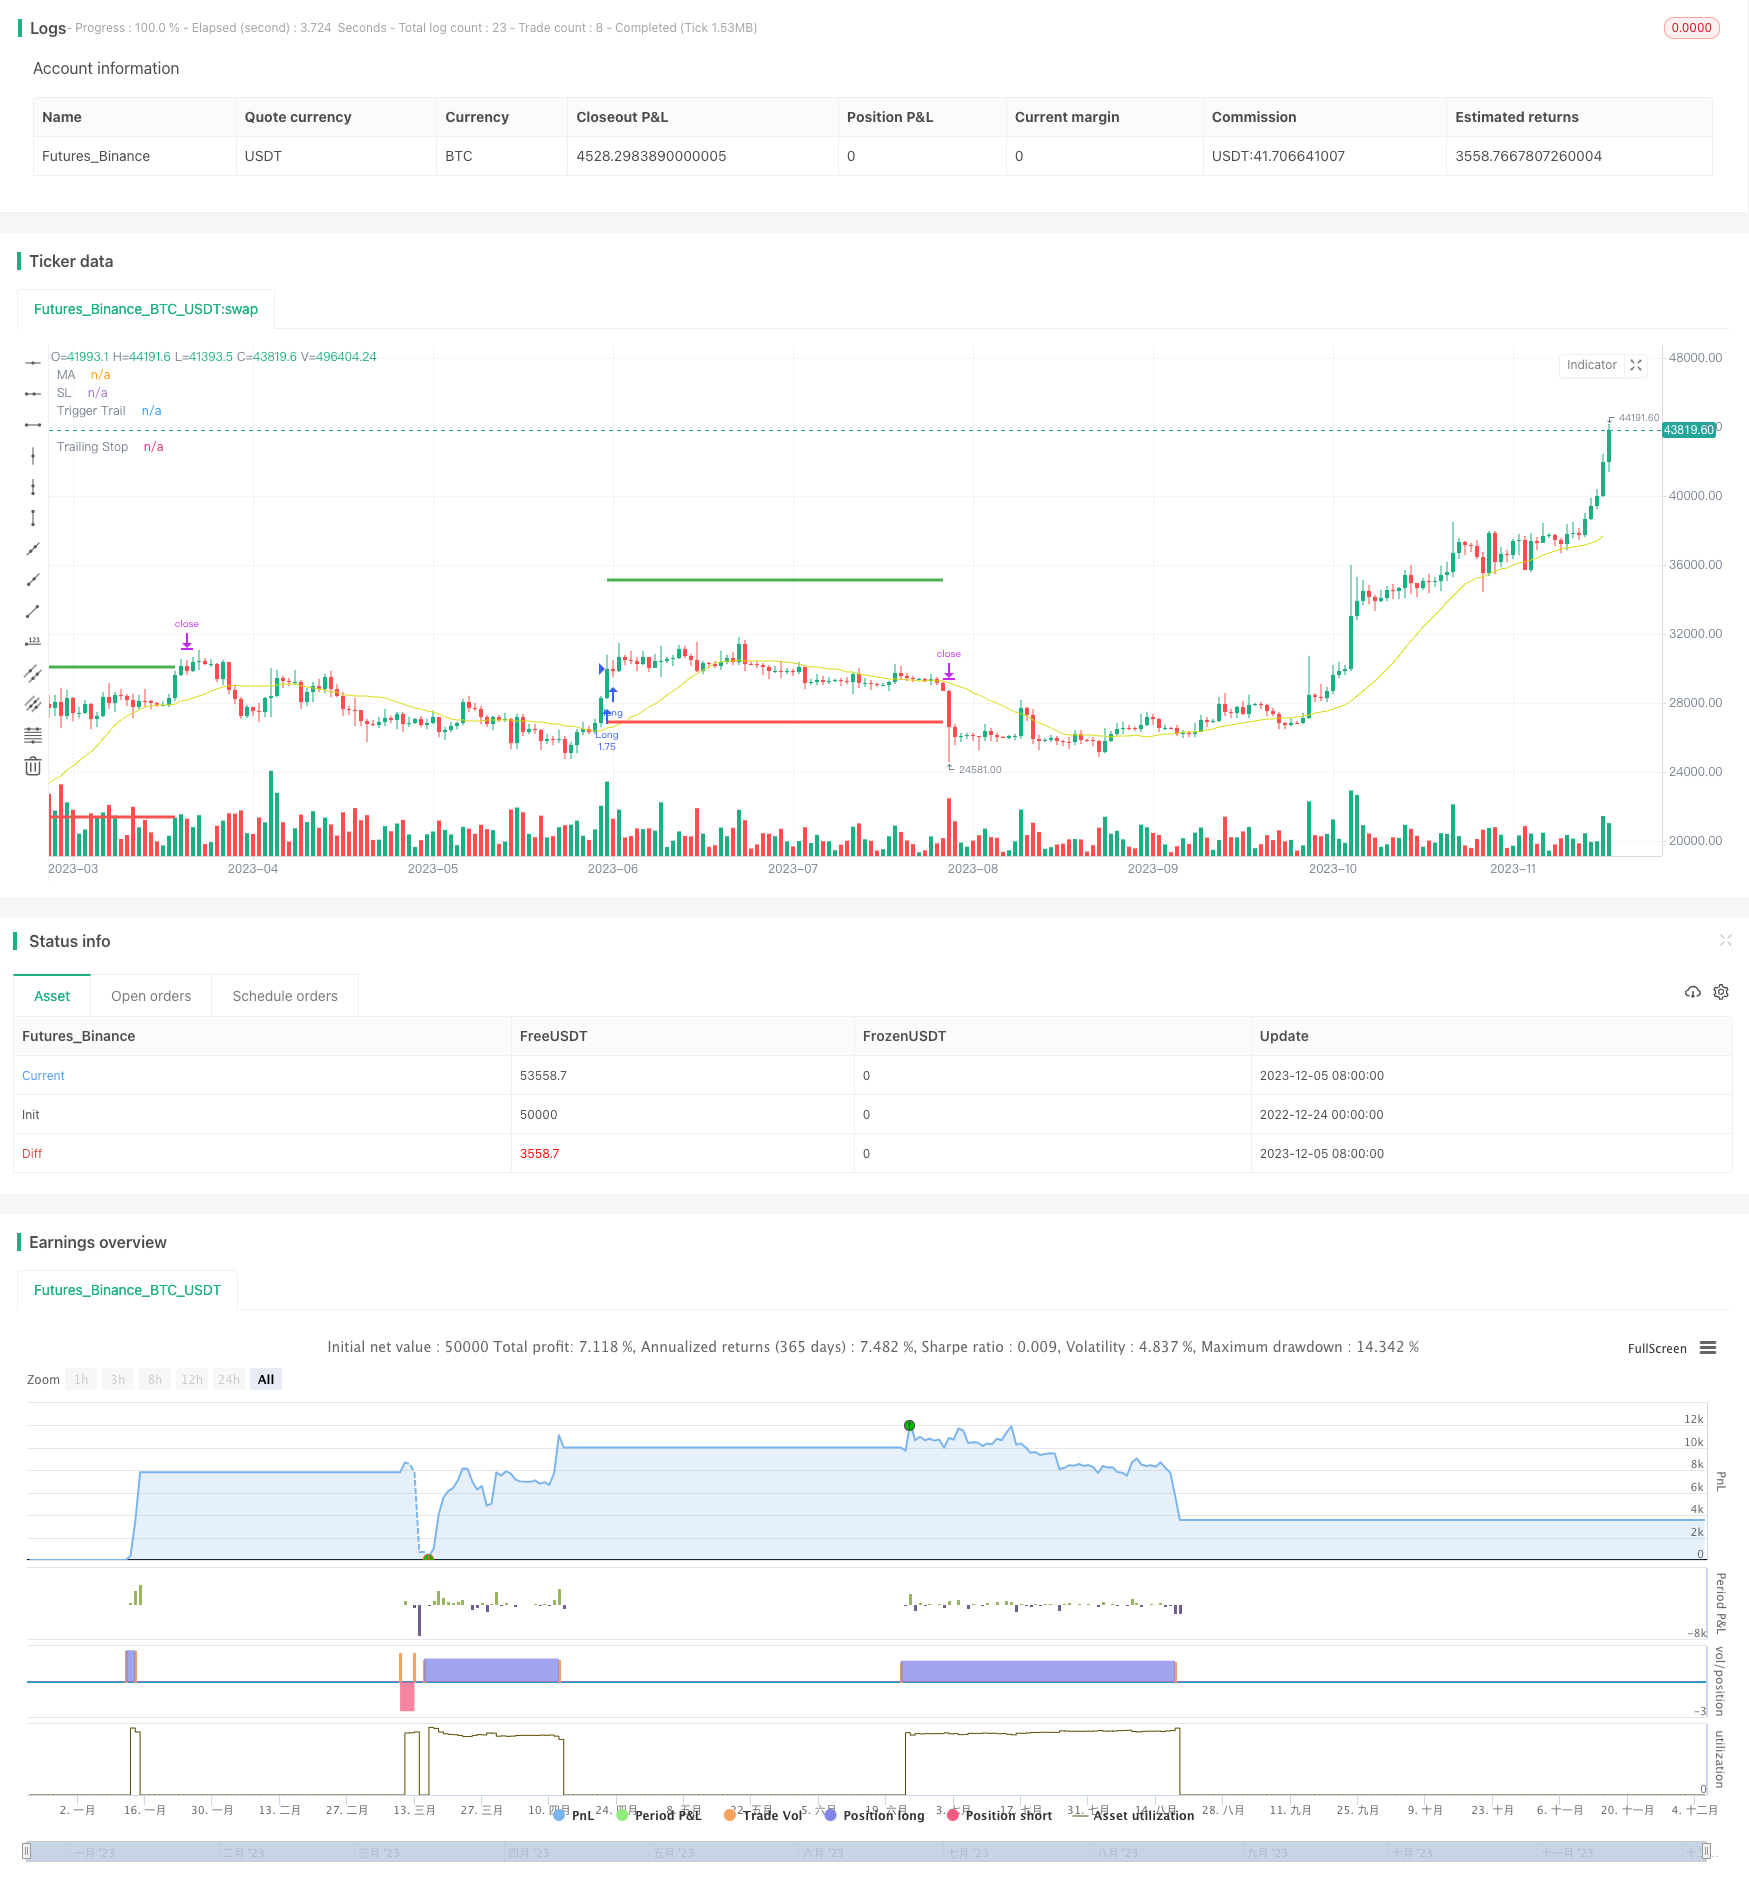
Esta estrategia utiliza RSI y WMA para determinar la dirección de la tendencia y obtener ganancias de las tendencias principales. Al mismo tiempo, utiliza la gestión de fondos y la estrategia de control de riesgos de parada.
/*backtest
start: 2022-12-24 00:00:00
end: 2023-12-06 05:20:00
period: 1d
basePeriod: 1h
exchanges: [{"eid":"Futures_Binance","currency":"BTC_USDT"}]
*/

// This source code is subject to the terms of the Mozilla Public License 2.0 at https://mozilla.org/MPL/2.0/
// © gsanson66


//This code is based on RSI and a backed weighted MA
//@version=5
strategy("RSI + MA BACKTESTING", overlay=true, initial_capital=1000, default_qty_type=strategy.fixed, commission_type=strategy.commission.percent, commission_value=0.18, slippage=3)


//------------------------TOOL TIPS---------------------------//

t1 = "Choice between a Standard MA (SMA) or a backed-weighted MA (RWMA) which permits to minimize the impact of short term reversal. Default is RWMA."
t2 = "Value of RSI to send a LONG or a SHORT signal. RSI above 60 is a LONG signal and RSI below 40 is a SHORT signal."
t3 = "Rate of Change Value of selected MA to send a LONG or a SHORT signal. By default : ROC MA below -1 is a LONG signal and ROC MA above 1 is a SHORT signal"
t4 = "Threshold value to trigger trailing Take Profit. This threshold is calculated as a multiple of the ATR (Average True Range)."
t5 = "Percentage value of trailing Take Profit. This Trailing TP follows the profit if it increases, remaining selected percentage below it, but stops if the profit decreases."
t6 = "Each gain or losse (relative to the previous reference) in an amount equal to this fixed ratio will change quantity of orders."
t7 = "The amount of money to be added to or subtracted from orders once the fixed ratio has been reached."


//------------------------FUNCTIONS---------------------------//

//@function which calculate a retro weighted moving average to minimize the impact of short term reversal
rwma(source, length) =>
    sum = 0.0
    denominator = 0.0
    weight = 0.0
    weight_x = 100/(4+(length-4)*1.30)
    weight_y = 1.30*weight_x
    for i=0 to length - 1
        if i <= 3
            weight := weight_x
        else
            weight := weight_y
        sum := sum + source[i] * weight
        denominator := denominator + weight
    rwma = sum/denominator

//@function which permits the user to choose a moving average type
ma(source, length, type) =>
    switch type
        "SMA" => ta.sma(source, length)
        "RWMA" => rwma(source, length)

//@function Displays text passed to `txt` when called.
debugLabel(txt, color) =>
    label.new(bar_index, high, text = txt, color=color, style = label.style_label_lower_right, textcolor = color.black, size = size.small)

//@function which looks if the close date of the current bar falls inside the date range
inBacktestPeriod(start, end) => (time >= start) and (time <= end)


//--------------------------------USER INPUTS-------------------------------//

//Technical parameters
rsiLengthInput = input.int(20, minval=1, title="RSI Length", group="RSI Settings")
maTypeInput = input.string("RWMA", title="MA Type", options=["SMA", "RWMA"], group="MA Settings", inline="1", tooltip=t1)
maLenghtInput = input.int(20, minval=1, title="MA Length", group="MA Settings", inline="1")
rsiLongSignalValue = input.int(60, minval=1, maxval=99, title="RSI Long Signal", group="Strategy parameters", inline="3")
rsiShortSignalValue = input.int(40, minval=1, maxval=99, title="RSI Short Signal", group="Strategy parameters", inline="3", tooltip=t2)
rocMovAverLongSignalValue = input.float(-1, maxval=0, title="ROC MA Long Signal", group="Strategy parameters", inline="4")
rocMovAverShortSignalValue = input.float(1, minval=0, title="ROC MA Short Signal", group="Strategy parameters", inline="4", tooltip=t3)
//TP Activation and Trailing TP
takeProfitActivationInput = input.float(5, minval=1.0, title="TP activation in multiple of ATR", group="Strategy parameters", tooltip=t4)
trailingStopInput = input.float(3, minval=0, title="Trailing TP in percentage", group="Strategy parameters", tooltip=t5)
//Money Management
fixedRatio = input.int(defval=400, minval=1, title="Fixed Ratio Value ($)", group="Money Management", tooltip=t6)
increasingOrderAmount = input.int(defval=200, minval=1, title="Increasing Order Amount ($)", group="Money Management", tooltip=t7)
//Backtesting period
startDate = input(title="Start Date", defval=timestamp("1 Jan 2018 00:00:00"), group="Backtesting Period")
endDate = input(title="End Date", defval=timestamp("1 July 2024 00:00:00"), group="Backtesting Period")


//------------------------------VARIABLES INITIALISATION-----------------------------//

float rsi = ta.rsi(close, rsiLengthInput)
float ma = ma(close, maLenghtInput, maTypeInput)
float roc_ma = ((ma/ma[maLenghtInput]) - 1)*100
float atr = ta.atr(20)
var float trailingStopOffset = na
var float trailingStopActivation = na
var float trailingStop = na
var float stopLoss = na
var bool long = na
var bool short = na
var bool bufferTrailingStopDrawing = na
float theoreticalStopPrice = na
bool inRange = na
equity = math.abs(strategy.equity - strategy.openprofit)
strategy.initial_capital = 50000
var float capital_ref = strategy.initial_capital
var float cashOrder = strategy.initial_capital * 0.95


//------------------------------CHECKING SOME CONDITIONS ON EACH SCRIPT EXECUTION-------------------------------//

//Checking if the date belong to the range
inRange := true

//Checking performances of the strategy
if equity > capital_ref + fixedRatio
    spread = (equity - capital_ref)/fixedRatio
    nb_level = int(spread)
    increasingOrder = nb_level * increasingOrderAmount
    cashOrder := cashOrder + increasingOrder
    capital_ref := capital_ref + nb_level*fixedRatio
if equity < capital_ref - fixedRatio
    spread = (capital_ref - equity)/fixedRatio
    nb_level = int(spread)
    decreasingOrder = nb_level * increasingOrderAmount
    cashOrder := cashOrder - decreasingOrder
    capital_ref := capital_ref - nb_level*fixedRatio

//Checking if we close all trades in case where we exit the backtesting period
if strategy.position_size!=0 and not inRange
    debugLabel("END OF BACKTESTING PERIOD : we close the trade", color=color.rgb(116, 116, 116))
    strategy.close_all()
    bufferTrailingStopDrawing := false
    stopLoss := na
    trailingStopActivation := na
    trailingStop := na
    short := false
    long := false


//------------------------------STOP LOSS AND TRAILING STOP ACTIVATION----------------------------//

// We handle the stop loss and trailing stop activation
if (low <= stopLoss or high >= trailingStopActivation) and long
    if high >= trailingStopActivation
        bufferTrailingStopDrawing := true
    else if low <= stopLoss
        long := false
    stopLoss := na
    trailingStopActivation := na
if (low <= trailingStopActivation or high >= stopLoss) and short
    if low <= trailingStopActivation
        bufferTrailingStopDrawing := true
    else if high >= stopLoss
        short := false
    stopLoss := na
    trailingStopActivation := na


//-------------------------------------TRAILING STOP--------------------------------------//

// If the traling stop is activated, we manage its plotting with the bufferTrailingStopDrawing
if bufferTrailingStopDrawing and long
    theoreticalStopPrice := high - trailingStopOffset * syminfo.mintick
    if na(trailingStop)
        trailingStop := theoreticalStopPrice
    else if theoreticalStopPrice > trailingStop
        trailingStop := theoreticalStopPrice
    else if low <= trailingStop
        trailingStop := na
        bufferTrailingStopDrawing := false
        long := false
if bufferTrailingStopDrawing and short
    theoreticalStopPrice := low + trailingStopOffset * syminfo.mintick
    if na(trailingStop)
        trailingStop := theoreticalStopPrice
    else if theoreticalStopPrice < trailingStop
        trailingStop := theoreticalStopPrice
    else if high >= trailingStop
        trailingStop := na
        bufferTrailingStopDrawing := false
        short := false


//---------------------------------LONG CONDITION--------------------------//

if rsi >= 60 and roc_ma <= rocMovAverLongSignalValue and inRange and not long
    if short
        bufferTrailingStopDrawing := false
        stopLoss := na
        trailingStopActivation := na
        trailingStop := na
        short := false
    trailingStopActivation := close + takeProfitActivationInput*atr
    trailingStopOffset := (trailingStopActivation * trailingStopInput/100) / syminfo.mintick
    stopLoss := close - 3*atr
    long := true
    qty = cashOrder/close
    strategy.entry("Long", strategy.long, qty)
    strategy.exit("Exit Long", "Long", stop = stopLoss, trail_price = trailingStopActivation,
                 trail_offset = trailingStopOffset)


//--------------------------------SHORT CONDITION-------------------------------//

if rsi <= 40 and roc_ma >= rocMovAverShortSignalValue and inRange and not short
    if long
        bufferTrailingStopDrawing := false
        stopLoss := na
        trailingStopActivation := na
        trailingStop := na
        long := false
    trailingStopActivation := close - takeProfitActivationInput*atr
    trailingStopOffset := (trailingStopActivation * trailingStopInput/100) / syminfo.mintick
    stopLoss := close + 3*atr
    short := true
    qty = cashOrder/close
    strategy.entry("Short", strategy.short, qty)
    strategy.exit("Exit Short", "Short", stop = stopLoss, trail_price = trailingStopActivation,
                 trail_offset = trailingStopOffset)


//--------------------------------PLOTTING ELEMENT---------------------------------//

// Plotting of element in the graph
plotchar(rsi, "RSI", "", location.top, color.rgb(0, 214, 243))
plot(ma, "MA", color.rgb(219, 219, 18))
plotchar(roc_ma, "ROC MA", "", location.top, color=color.orange)
// Visualizer trailing stop and stop loss movement
plot(stopLoss, "SL", color.red, 3, plot.style_linebr)
plot(trailingStopActivation, "Trigger Trail", color.green, 3, plot.style_linebr)
plot(trailingStop, "Trailing Stop",  color.blue, 3, plot.style_linebr)