Estrategia de seguimiento de tendencias basada en el cruce de indicadores TEMA de múltiples marcos temporales
Descripción general
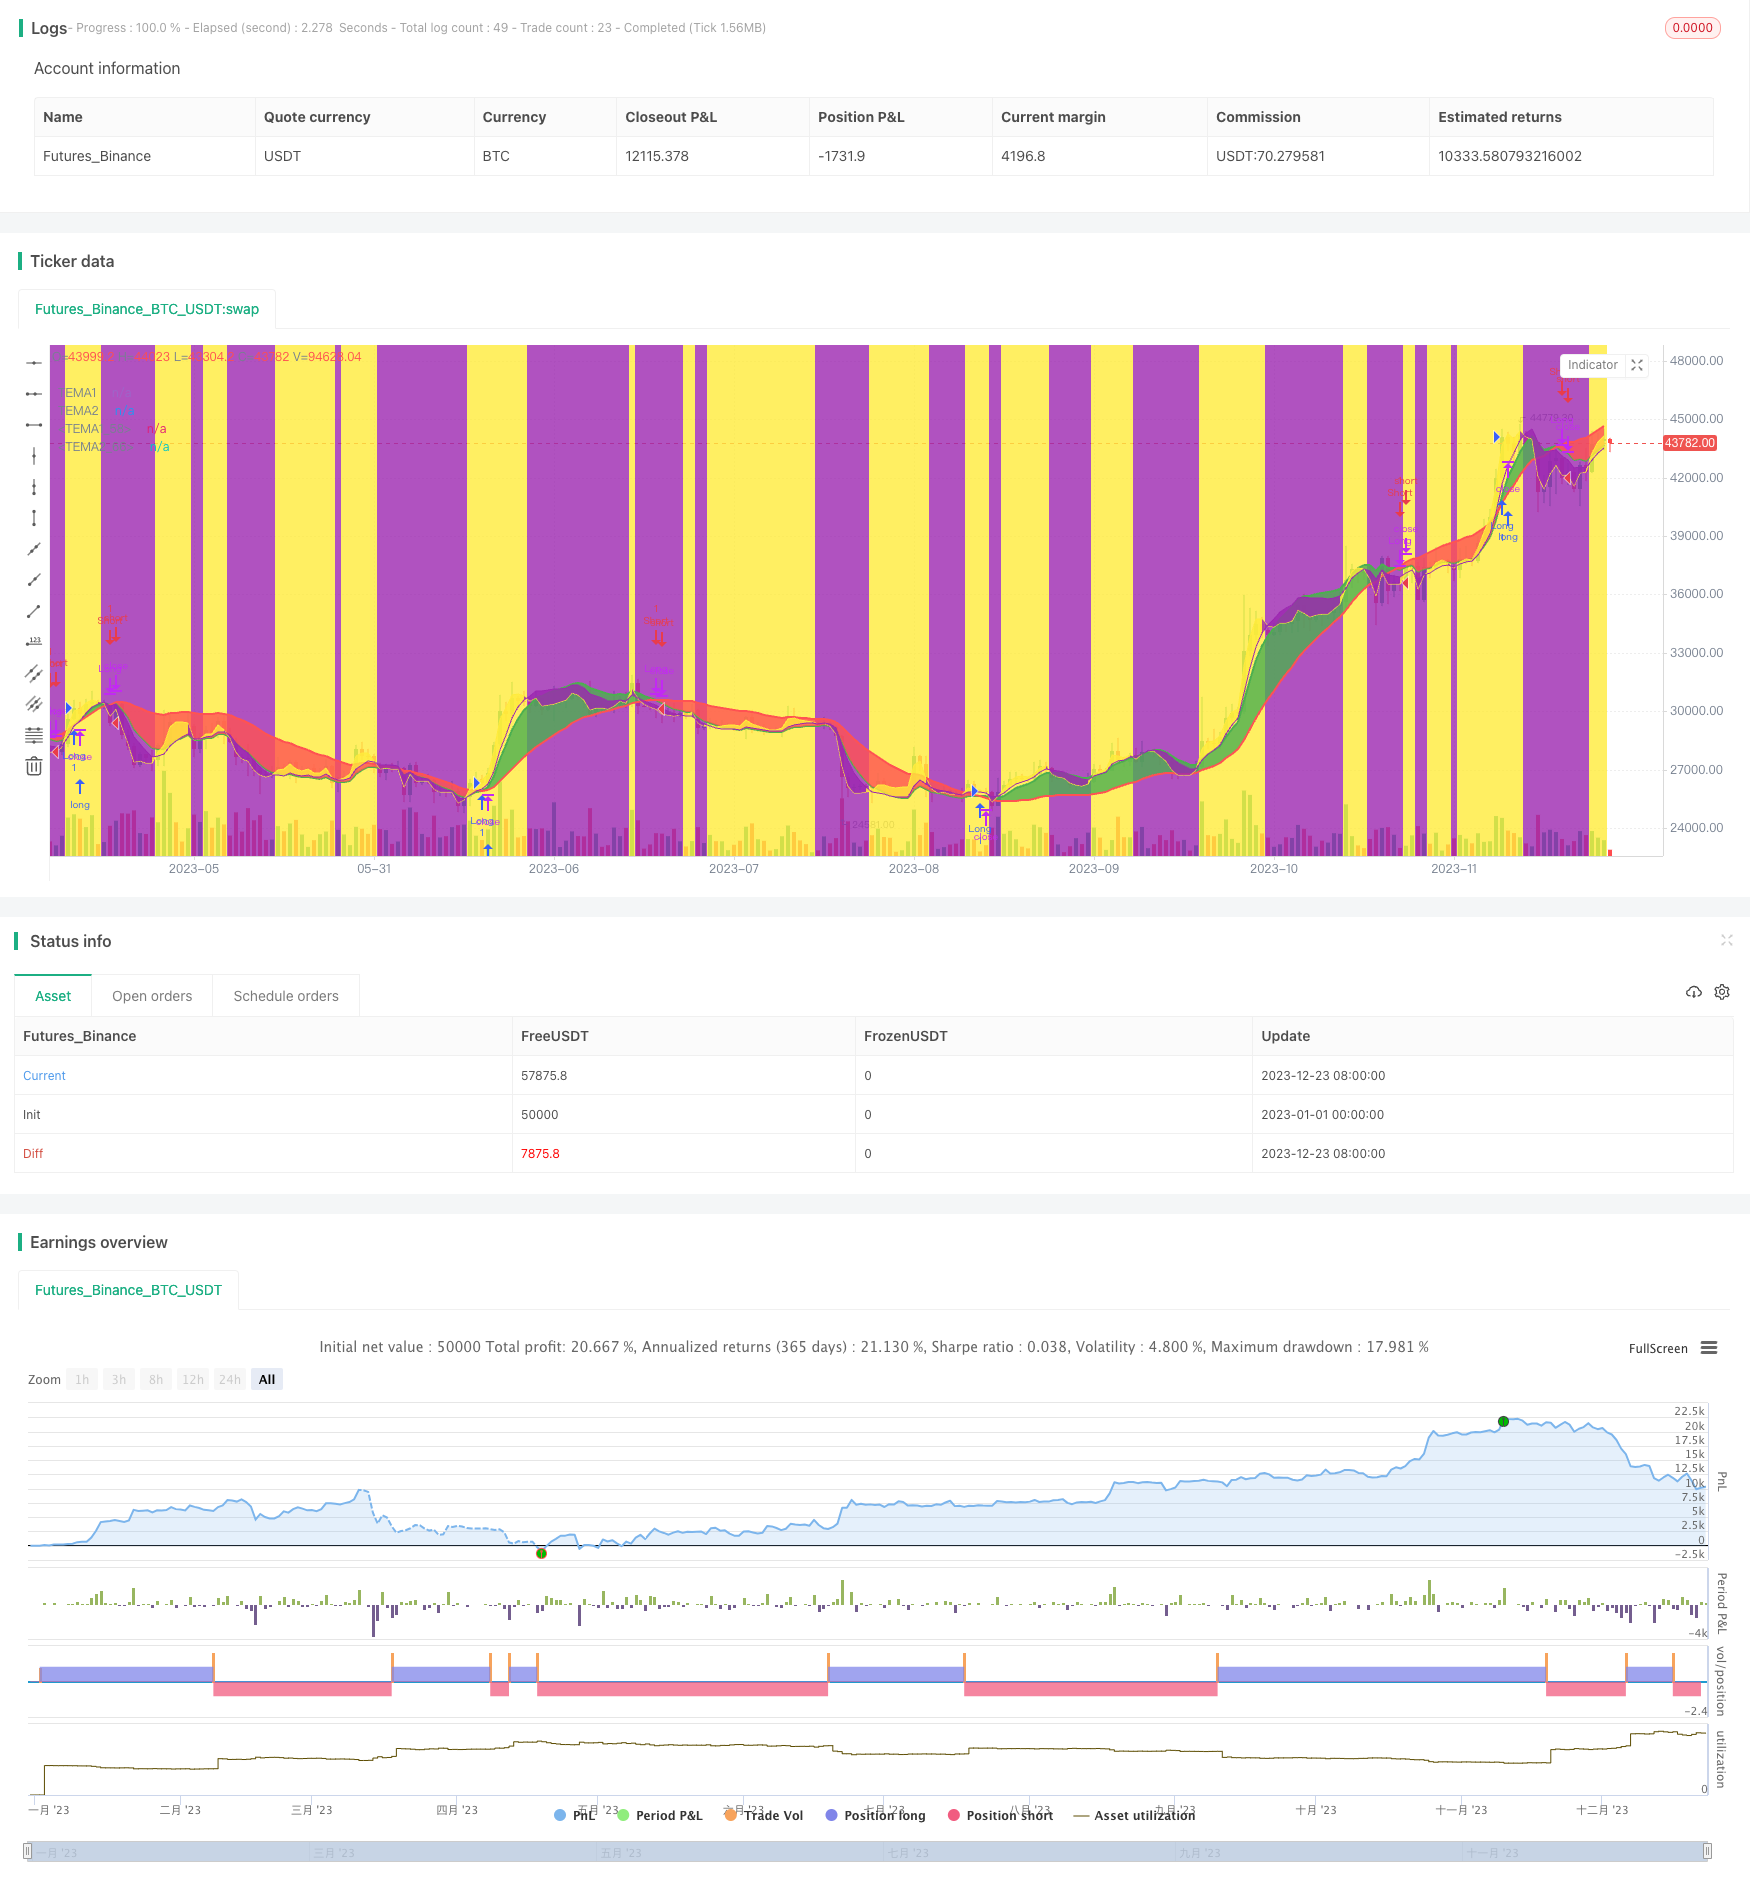
La estrategia se basa en el cruce de varios marcos temporales del indicador TEMA para identificar la dirección de la tendencia del mercado, y se combina con el cruce del indicador TEMA en marcos temporales más bajos para buscar momentos específicos de entrada y salida. La estrategia se puede configurar para hacer solo más, solo a la baja o en ambos sentidos.
Principio de estrategia
La estrategia utiliza dos indicadores TEMA, uno basado en la línea rápida y lenta de los períodos 5 y 15, y el otro basado en un marco de tiempo de alto ciclo personalizado por el usuario, como la línea diaria o la línea de circunferencia. El cruce de los indicadores TEMA de alto ciclo determina la dirección de la tendencia general, y cuando la línea rápida atraviesa la línea lenta, se ve al alza y baja al alza. El cruce de los indicadores TEMA de bajo ciclo se utiliza para buscar entradas y salidas específicas.
Cuando el TEMA de alta frecuencia atraviesa la línea lenta, el TEMA de baja frecuencia atraviesa la línea lenta y se puede jugar más; cuando el TEMA de baja frecuencia atraviesa la línea lenta, se debe jugar. De manera similar, cuando el TEMA de alta frecuencia atraviesa la línea lenta, el TEMA de baja frecuencia atraviesa la línea lenta y se puede jugar en blanco; cuando el TEMA de baja frecuencia atraviesa la línea lenta, se debe jugar.
Ventajas estratégicas
- Cruzarse con indicadores basados en TEMA para evitar ser engañados por el ruido
- Establecimiento de múltiples marcos de tiempo, combinado con un alto y bajo juicio de ciclo, para una mayor precisión
- Puede ser unilateral o bidireccional, con una configuración flexible
- Las reglas son claras y fáciles de entender
Análisis de riesgos
- El índice TEMA está rezagado y podría haber perdido el primer momento de cambio de precios
- Los ajustes a corto plazo en el juicio de tendencias de alta periodicidad pueden conducir a una inversión innecesaria
- La configuración de alta frecuencia no fue elegida correctamente y puede no reflejar las tendencias reales
- La configuración de ciclo bajo puede aumentar el riesgo de pérdidas
La solución al riesgo:
- Ajuste adecuado de los parámetros de TEMA para lograr un equilibrio
- Disminuir el margen de amortización adecuadamente
- Optimización de los parámetros de alta y baja frecuencia Setting
- Pruebas de robustez de diferentes variedades
Dirección de optimización
- Ajuste dinámico de los parámetros de TEMA para optimizar la sensibilidad del indicador
- Aumentar los filtros de los indicadores de movimiento para evitar tendencias perdidas
- Aumento de los indicadores de volatilidad y ajuste dinámico de los límites de pérdida
- Parámetros de optimización de métodos de aprendizaje automático
Resumir
El concepto general de la estrategia es claro y fácil de entender, se basa en el indicador TEMA para determinar la dirección de la tendencia en el cruce de los marcos temporales múltiples, y se combina con el cruce de los períodos bajos para buscar el momento de entrada. Hay ciertas ventajas, pero también hay espacio para mejorar. En general, la estrategia proporciona una referencia valiosa para las prácticas de comercio cuantitativo.
/*backtest
start: 2023-01-01 00:00:00
end: 2023-12-24 00:00:00
period: 1d
basePeriod: 1h
exchanges: [{"eid":"Futures_Binance","currency":"BTC_USDT"}]
*/

// This source code is subject to the terms of the Mozilla Public License 2.0 at https://mozilla.org/MPL/2.0/
// © Seltzer_

//@version=4
strategy(title="TEMA Cross +HTF Backtest", shorttitle="TEMA_X_+HTF_BT", overlay=true)

orderType = input("Longs+Shorts",title="What type of Orders", options=["Longs+Shorts","LongsOnly","ShortsOnly"])
isLong   = (orderType != "ShortsOnly")
isShort  = (orderType != "LongsOnly")

// Backtest Section {

// Backtest inputs
FromMonth = input(defval=1, title="From Month", minval=1, maxval=12)
FromDay = input(defval=1, title="From Day", minval=1, maxval=31)
FromYear = input(defval=2020, title="From Year", minval=2010)
ToMonth = input(defval=1, title="To Month", minval=1, maxval=12)
ToDay = input(defval=1, title="To Day", minval=1, maxval=31)
ToYear = input(defval=9999, title="To Year", minval=2017)

// Define backtest timewindow
start = timestamp(FromYear, FromMonth, FromDay, 00, 00)  // backtest start window
finish = timestamp(ToYear, ToMonth, ToDay, 23, 59)  // backtest finish window
window() => true

// }

//TEMA Section {

//LTF Section
xLength = input(20, minval=1, title="Fast Length")
xPrice = close
xEMA1 = ema(xPrice, xLength)
xEMA2 = ema(xEMA1, xLength)
xEMA3 = ema(xEMA2, xLength)
xnRes = (3 * xEMA1) - (3 * xEMA2) + xEMA3
xnResP = plot(xnRes, color=color.green, linewidth=2, title="TEMA1")

yLength = input(60, minval=1, title="Slow Length")
yPrice = close
yEMA1 = ema(yPrice, yLength)
yEMA2 = ema(yEMA1, yLength)
yEMA3 = ema(yEMA2, yLength)
ynRes = (3 * yEMA1) - (3 * yEMA2) + yEMA3
ynResP = plot(ynRes, color=color.red, linewidth=2, title="TEMA2")

fill(xnResP, ynResP, color=xnRes > ynRes ? color.green : color.red, transp=65, editable=true)

//HTF Section
HTFres = input(defval="D", type=input.resolution, title="HTF Resolution")

HTFxLength = input(5, minval=1, title="HTF Fast Length")
HTFxPrice = close
HTFxEMA1 = security(syminfo.tickerid, HTFres, ema(HTFxPrice, HTFxLength), barmerge.gaps_off, barmerge.lookahead_on)
HTFxEMA2 = security(syminfo.tickerid, HTFres, ema(HTFxEMA1, HTFxLength), barmerge.gaps_off, barmerge.lookahead_on)
HTFxEMA3 = security(syminfo.tickerid, HTFres, ema(HTFxEMA2, HTFxLength), barmerge.gaps_off, barmerge.lookahead_on)
HTFxnRes = (3 * HTFxEMA1) - (3 * HTFxEMA2) + HTFxEMA3
HTFxnResP = plot(HTFxnRes, color=color.yellow, linewidth=1,transp=30, title="TEMA1")

HTFyLength = input(15, minval=1, title="HTF Slow Length")
HTFyPrice = close
HTFyEMA1 = security(syminfo.tickerid, HTFres, ema(HTFyPrice, HTFyLength), barmerge.gaps_off, barmerge.lookahead_on)
HTFyEMA2 = security(syminfo.tickerid, HTFres, ema(HTFyEMA1, HTFyLength), barmerge.gaps_off, barmerge.lookahead_on)
HTFyEMA3 = security(syminfo.tickerid, HTFres, ema(HTFyEMA2, HTFyLength), barmerge.gaps_off, barmerge.lookahead_on)
HTFynRes = (3 * HTFyEMA1) - (3 * HTFyEMA2) + HTFyEMA3
HTFynResP = plot(HTFynRes, color=color.purple, linewidth=1, transp=30, title="TEMA2")

fill(HTFxnResP, HTFynResP, color=HTFxnRes > HTFynRes ? color.yellow : color.purple, transp=90, editable=true)
bgcolor(HTFxnRes > HTFynRes ? color.yellow : na, transp=90, editable=true)
bgcolor(HTFxnRes < HTFynRes ? color.purple : na, transp=90, editable=true)

// }

// Buy and Sell Triggers
LongEntryAlert = xnRes > ynRes and HTFxnRes > HTFynRes and window()
LongCloseAlert = xnRes < ynRes and window()
ShortEntryAlert = xnRes < ynRes and HTFxnRes < HTFynRes and window()
ShortCloseAlert = xnRes > ynRes

// Entry & Exit signals
if isLong
    strategy.entry("Long", strategy.long, when = LongEntryAlert)
    strategy.close("Long", when = LongCloseAlert)

if isShort
    strategy.entry("Short", strategy.short, when = ShortEntryAlert)
    strategy.close("Short", when = ShortCloseAlert)