Estrategia de seguimiento de tendencia de canal oscilante de marco de tiempo múltiple
[trans]
Descripción general
La estrategia se basa en un indicador de tendencias súper, combinado con análisis de tendencias del mercado en varios marcos de tiempo, y utiliza un método de canal de choque para identificar el momento de entrada.
Principio de estrategia
- El uso de indicadores de tendencias tradicionales para determinar la dirección de la tendencia
- Aumentar las tendencias de los supermarcos de alta franja de tiempo y asegurar que también haya tendencias en los marcos de alta franja de tiempo
- Para juzgar la dirección de la tendencia general en función de los indicadores de tendencia súper de los dos marcos de tiempo
- Determinación del momento de entrada específico según la subida y bajada de la brecha de la oscilación del precio
Análisis de las ventajas
- Análisis de múltiples marcos de tiempo para determinar tendencias con mayor confianza
- La combinación de marcos de tiempo altos y bajos garantiza tendencias generales y captura oportunidades a corto plazo
- Los canales de vibración establecen puntos de parada para controlar el riesgo
Riesgos y soluciones
- Las supertendencias tienen su propio retraso y pueden perder el punto de cambio de tendencia.
- La conversión de tendencias se puede conocer mediante la optimización de parámetros o en combinación con otros indicadores para reducir el riesgo de atraso
Dirección de optimización
- Optimización de los parámetros de la tendencia súper y reducción de los problemas de atraso
- Aumentar los filtros de tendencia para asegurar una mayor precisión en las tendencias
- Prueba y selecciona el método de detención más adecuado
Resumir
La estrategia integra análisis de marcos temporales múltiples y indicadores de seguimiento de tendencias para dominar las principales tendencias y buscar momentos de entrada específicos. A través de la optimización continua, se espera obtener ganancias adicionales estables a largo plazo.
||
Overview
This strategy is based on the Supertrend indicator, combined with multiple timeframe market trend analysis, and adopts the oscillation channel method to identify entry opportunities.
Strategy Principle
- Use the traditional Supertrend indicator to determine the trend direction
- Add Supertrend of higher timeframe to ensure there is a trend in higher timeframe too
- Determine the overall trend direction based on the Supertrend indicators of two timeframes
- Identify specific entry opportunities based on the price breakout of the upper and lower rails of the oscillation channel
Advantage Analysis
- Multi-timeframe analysis makes trend judgment more reliable
- Combining high and low timeframes ensures catching the major trend while being able to capture short-term opportunities
- The oscillation channel setting stops loss points which helps risk control
Risks and Solutions
- The Supertrend itself has some lagging phenomenon, which may miss trend reversal points
- The lagging risk can be reduced by optimizing parameters or incorporating other indicators to assist in identifying trend changes
Optimization Directions
- Optimize Supertrend parameters to reduce lagging
- Add trend filtering indicators to ensure catching the major trend more accurately
- Test and select more appropriate stop loss methods
Summary
This strategy integrates multi-timeframe analysis and trend tracking indicators to grasp the major trend while seeking specific entry opportunities. With continuous optimization, it is expected to achieve long-term steady excess returns.
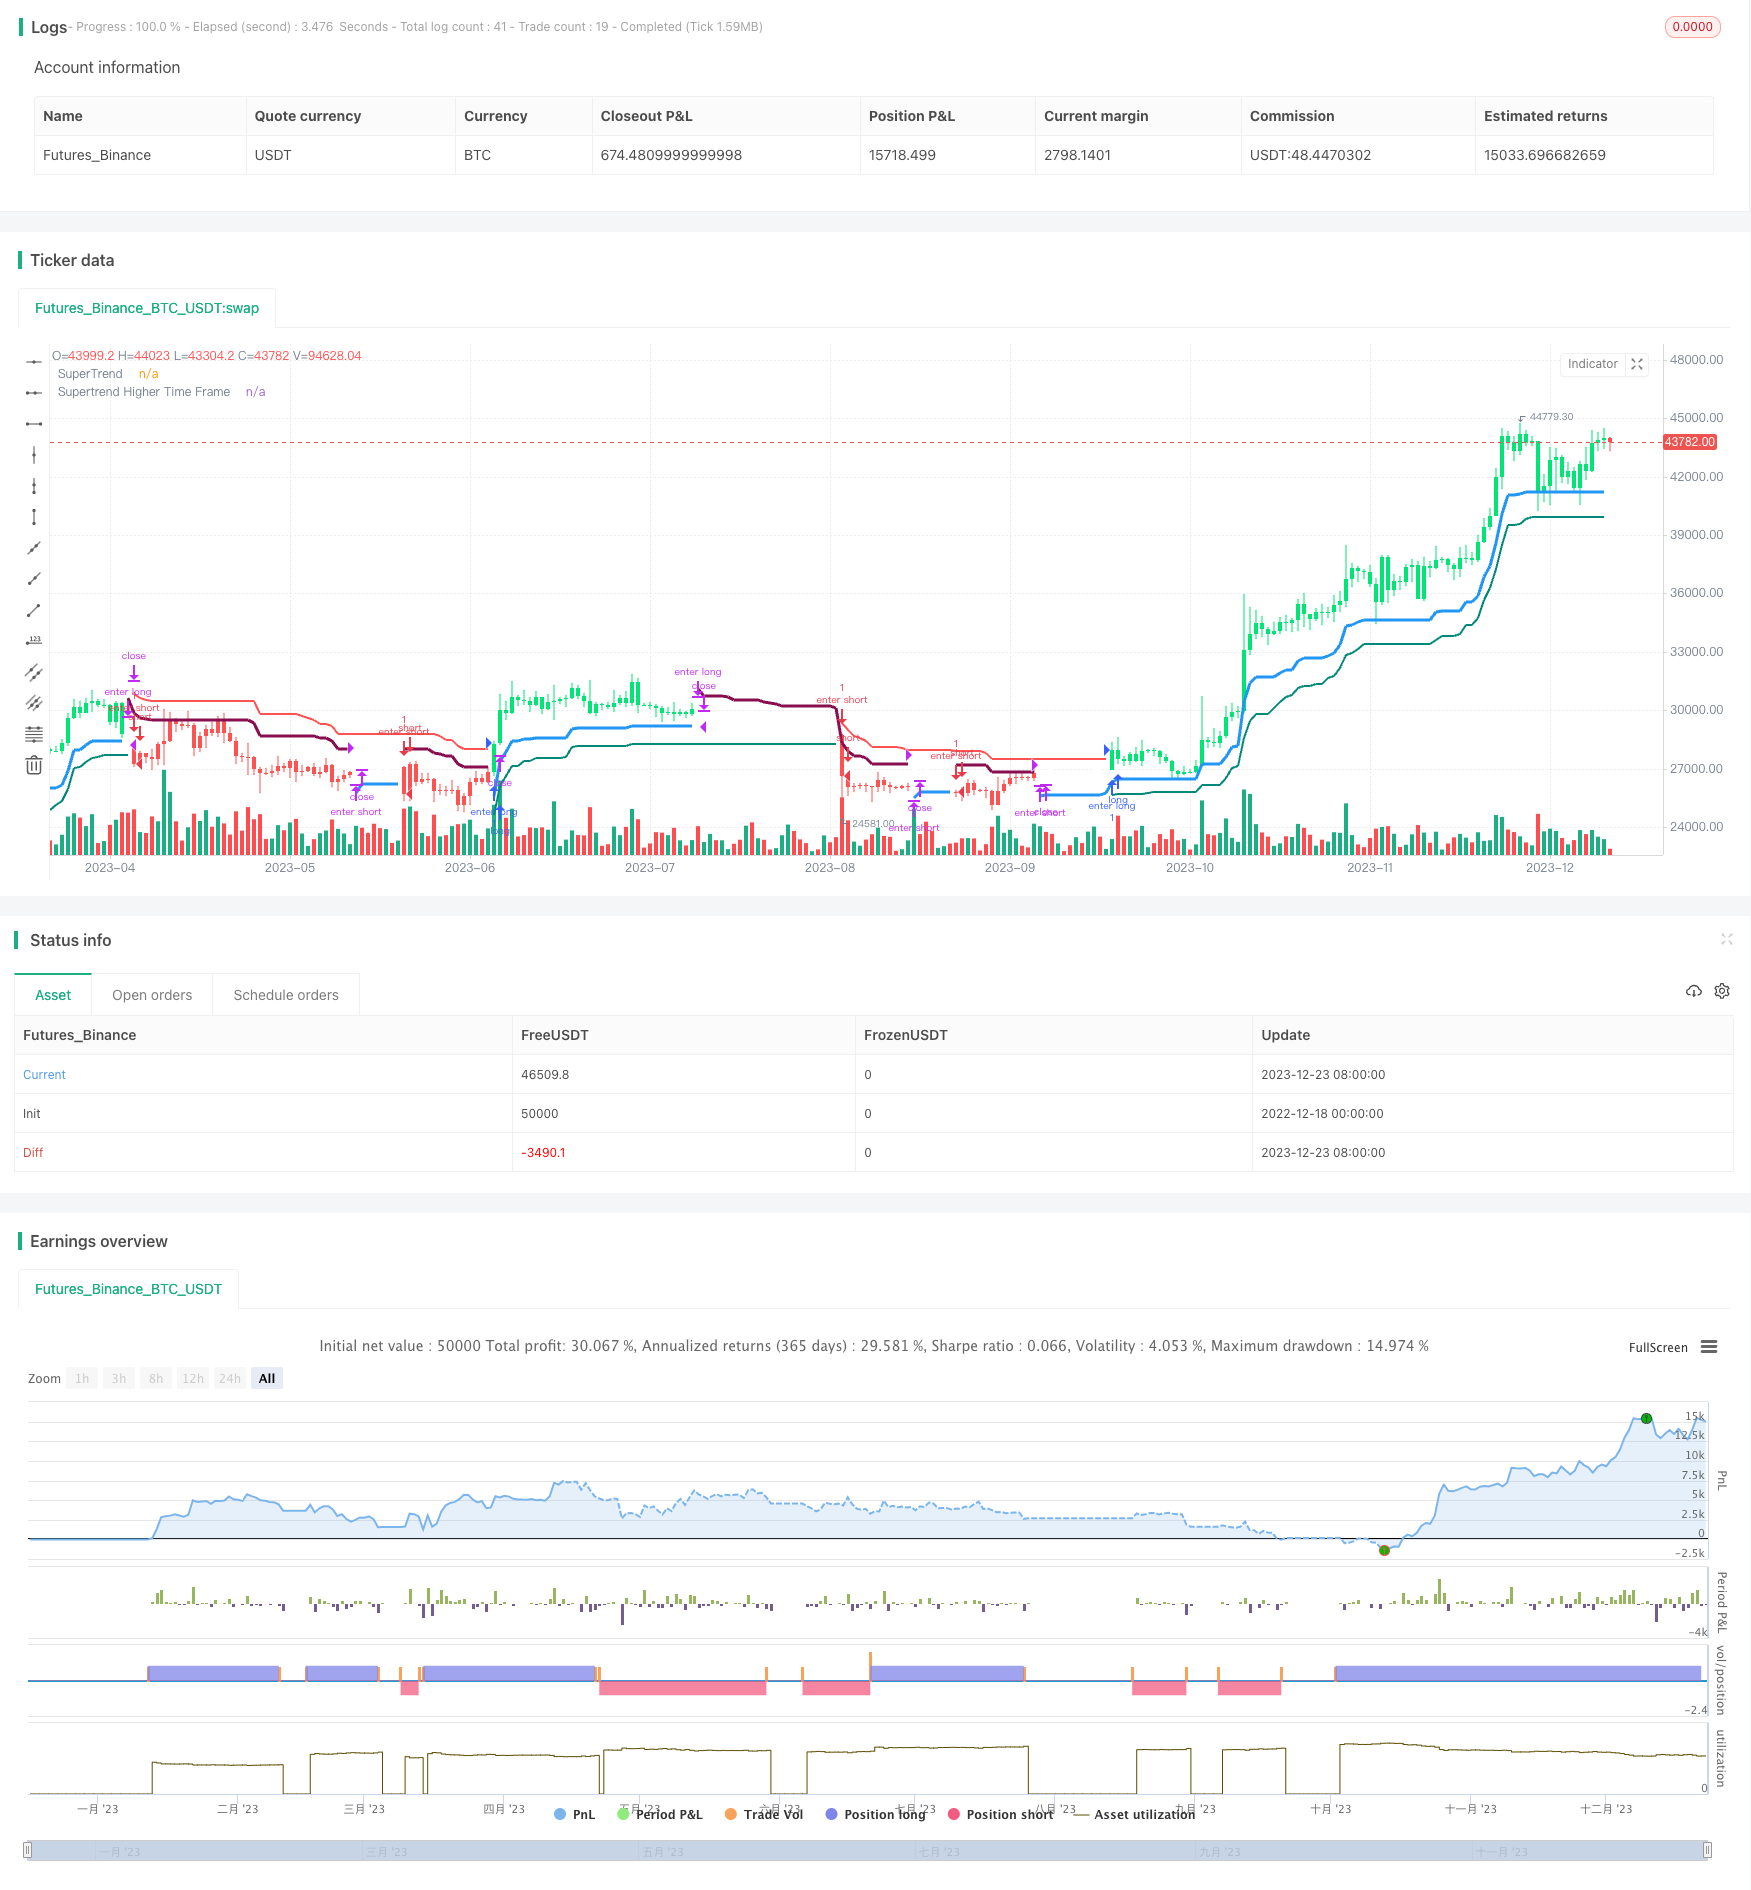
/*backtest
start: 2022-12-18 00:00:00
end: 2023-12-24 00:00:00
period: 1d
basePeriod: 1h
exchanges: [{"eid":"Futures_Binance","currency":"BTC_USDT"}]
*/

// This source code is subject to the terms of the Mozilla Public License 2.0 at https://mozilla.org/MPL/2.0/
// © ramki_simple
// Thanks to LonesomeTheBlue for the original code
//@version=4
strategy("Multi Supertrend with no-repaint HTF option strategy", overlay = true, shorttitle='Multi Supertrend')
//auto higher time frame
HTFAuto = timeframe.period == '1' ? '5' :
  timeframe.period == '3' ? '15' :
  timeframe.period == '5' ? '15' :
  timeframe.period == '15' ? '60' :
  timeframe.period == '30' ? '60' :
  timeframe.period == '45' ? '60' :
  timeframe.period == '60' ? '240' :
  timeframe.period == '120' ? '240' :
  timeframe.period == '180' ? '240' :
  timeframe.period == '240' ? 'D' :
  timeframe.period == 'D' ? 'W' :
  '5W'
HTFSelection = input(title='Select HTF Automatically for Additional Supertrend', type=input.bool, defval=false)
HTFUserSel = input(title='Select Higher Timeframe for Additional Supertrend',type=input.resolution, defval ='')
HTF = HTFSelection ? HTFAuto : HTFUserSel


Mult1 = input(title='Multiplier for Default Supertrend', defval=3.0, minval = 0, maxval = 10)
Period1 = input(title='Period for Default Supertrend', defval=10, minval = 1, maxval = 100)
Mult2 = input(title='Multiplier for Additional Supertrend', defval=2.0, minval = 0, maxval = 10)
Period2 = input(title='Period for Additional Supertrend', defval=14, minval = 1, maxval = 100)

chbarcol = input(true, title = "Change Bar Color")

[Trailings, Trend] = supertrend(Mult1, Period1)

linecolor = Trend == -1 and Trend[1] == -1 ? color.teal :
   Trend == 1 and Trend[1] == 1 ? color.red :
   color.new(color.white, 100)
plot(Trailings, color = linecolor,  linewidth = 2,title = "SuperTrend")

f_Security(_symbol, _res, _src) => security(_symbol, _res, _src[1], lookahead = barmerge.lookahead_on)

nonVectorSupertrend(Mult, Period) =>
    [Trail_, Trend_] = supertrend(Mult, Period)
    Trail_*Trend_


[TrailingslHtf, TrendHtf] = supertrend(Mult2, Period2)

if HTF != timeframe.period and HTF != ''
    CompositeTrailHtf = f_Security(syminfo.tickerid, HTF,nonVectorSupertrend(Mult2, Period2) )
    TrailingslHtf := abs(CompositeTrailHtf)
    TrendHtf := CompositeTrailHtf > 0 ? 1 : -1


linecolorHtf = TrendHtf == -1 and TrendHtf[1] == -1 ? color.blue :
   TrendHtf == 1 and TrendHtf[1] == 1 ? color.maroon :
   color.new(color.white, 100)
plot(TrailingslHtf, color = linecolorHtf, linewidth = 3, title = "Supertrend Higher Time Frame")

barcolor_ = Trend == -1 and TrendHtf == -1 ? color.lime :
   Trend == 1 and TrendHtf == 1 ? color.red :
   color.white
barcolor(color = chbarcol ? barcolor_ : na)

vwapfilter = input(false)

Long = Trend == -1 and TrendHtf == -1
Short = Trend == 1 and TrendHtf == 1
strategy.entry("enter long", true, 1, when = Long and not Long[1] and (vwapfilter and close > vwap or not vwapfilter))
strategy.entry("enter short", false, 1, when = Short and not Short[1] and (vwapfilter and close < vwap or not vwapfilter))
strategy.close("enter long", when = Long[1] and not Long)
strategy.close("enter short", when = Short[1] and not Short)