Estrategia de trading de inversión de tendencia basada en el cruce de EMA
Descripción general
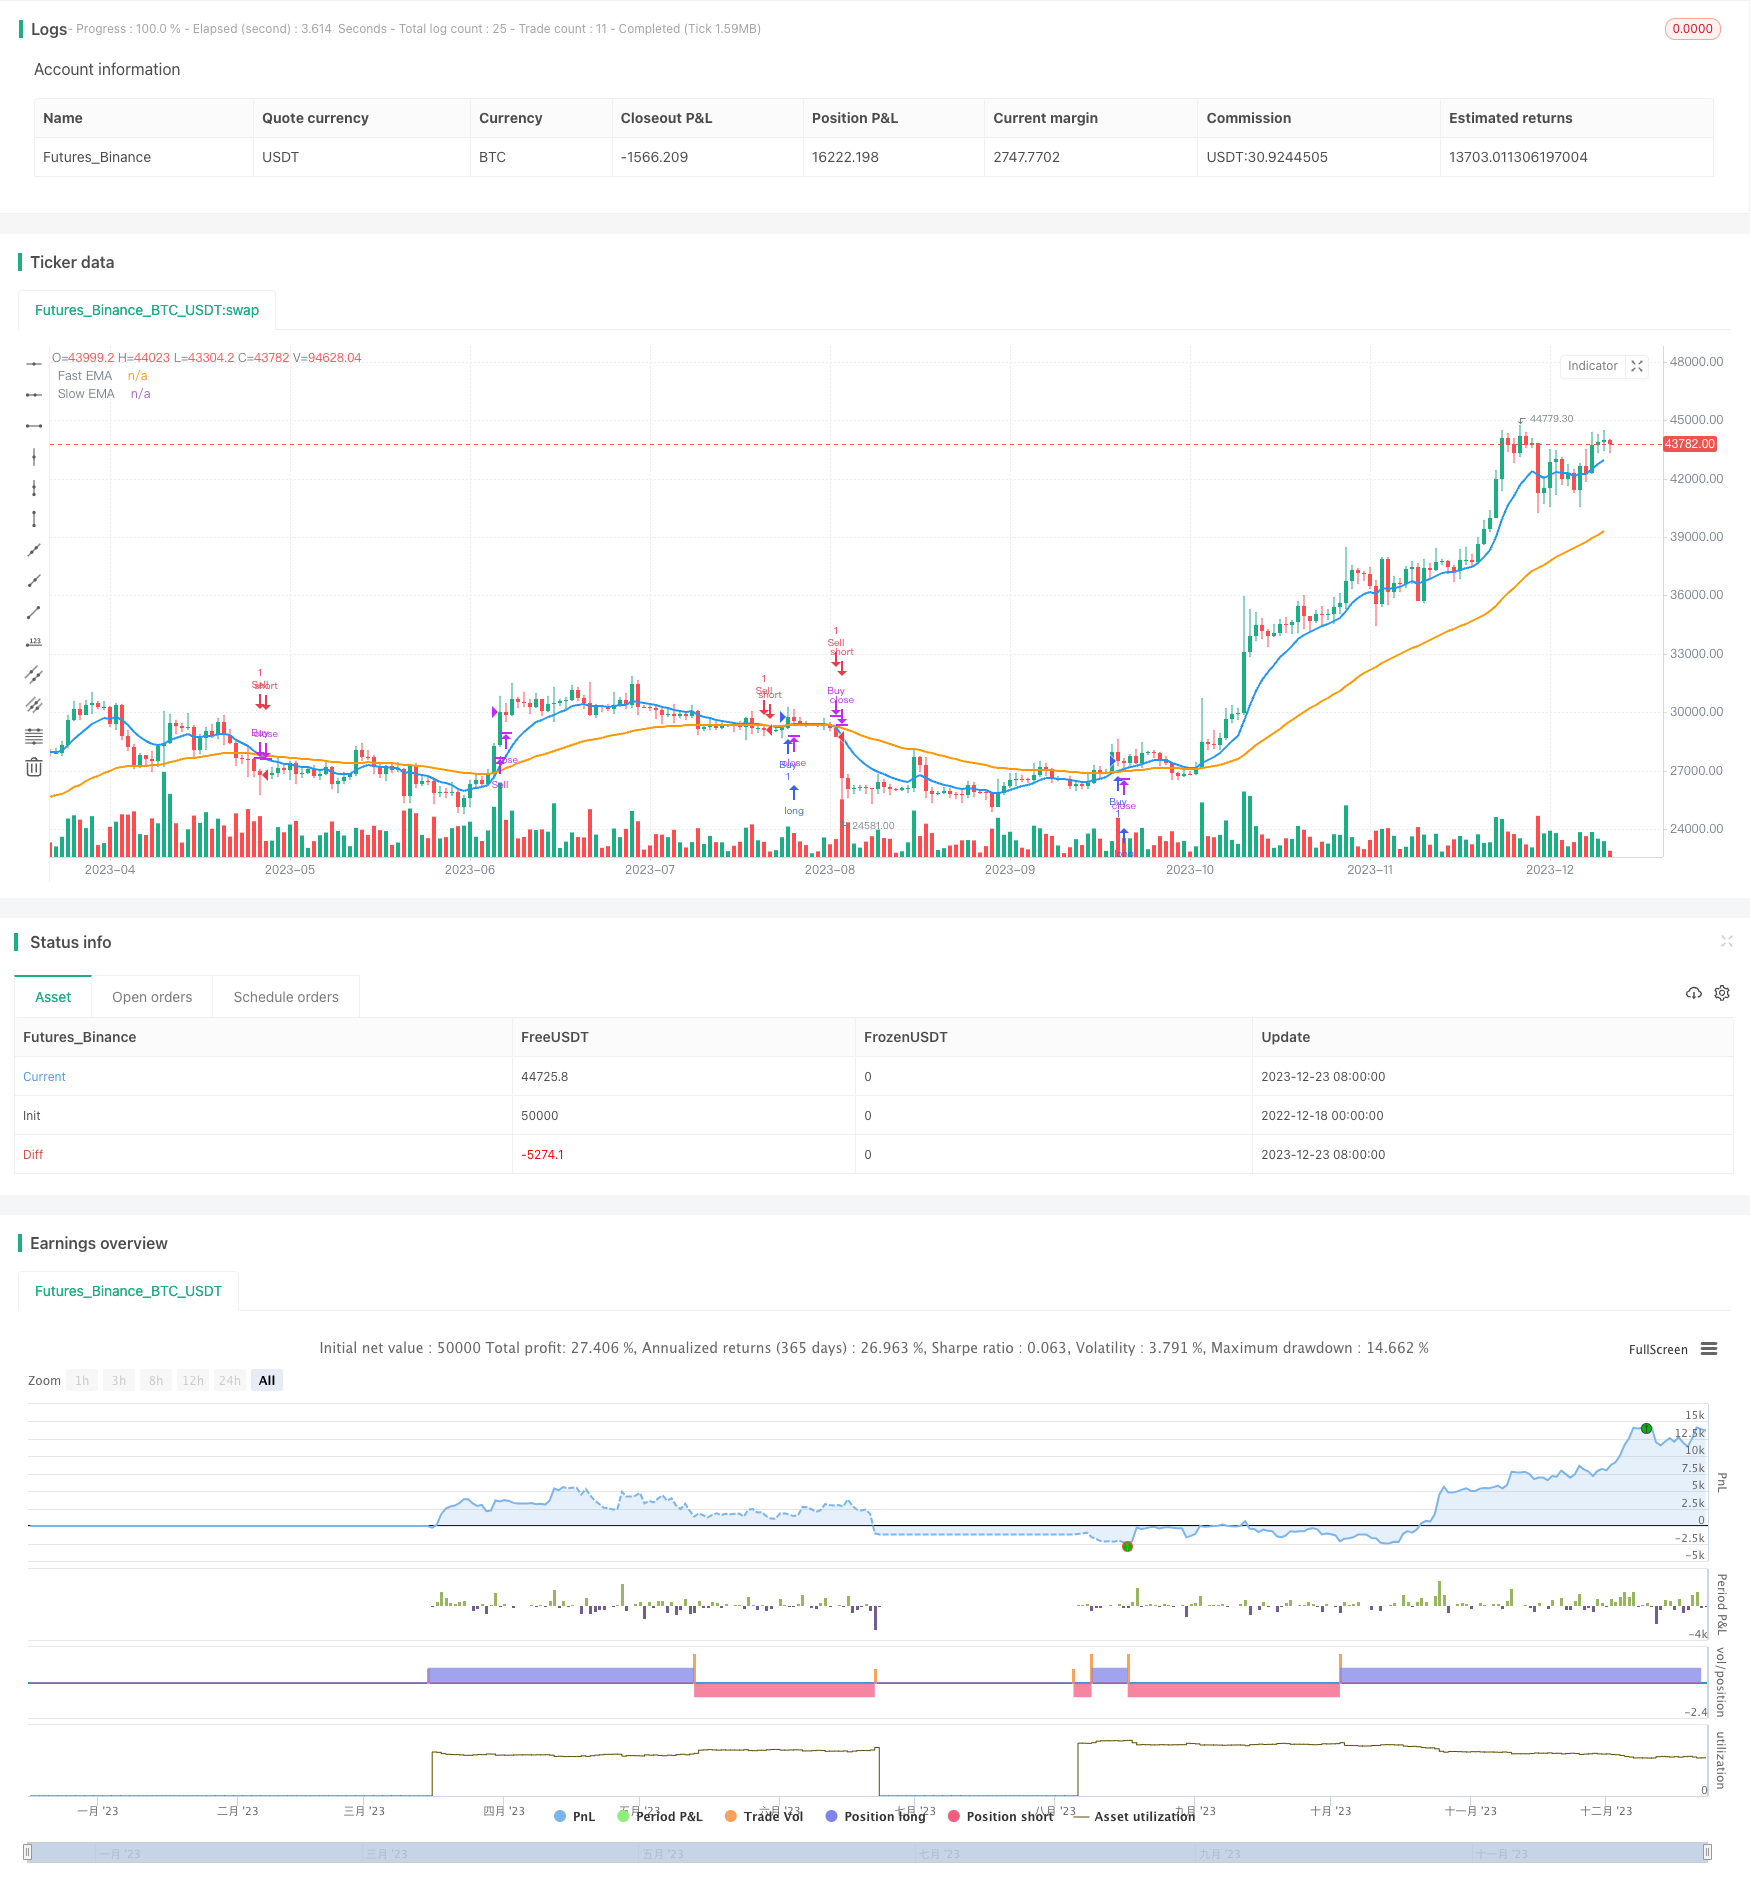
La estrategia se basa en calcular el promedio móvil del índice de los períodos EMA rápido y EMA lento, y trazarlo en el gráfico para monitorear su intersección en tiempo real y determinar la dirección de la tendencia de los precios. En combinación con el RSI, el indicador de sobreventa y sobrecompra evita falsas señales y forma una señal de negociación. Se genera una señal de compra cuando el EMA rápido se rompe hacia arriba con el EMA lento; se genera una señal de venta cuando el EMA rápido se cae hacia abajo con el EMA lento.
Principio de estrategia
- Calcula el promedio móvil exponencial de los períodos de EMA rápido y lento
- Mapear en gráficos y monitorear las intersecciones en tiempo real
- El EMA rápido se considera una tendencia alcista cuando se rompe el EMA lento hacia arriba y se forma una señal de compra
- El EMA rápido se considera una tendencia a la baja cuando se rompe el EMA lento hacia abajo y se forma una señal de venta
- Combinación con el RSI para evitar falsas señales
- Establecer condiciones de filtro de tendencia y comerciar solo cuando la tendencia cambia
Análisis de las ventajas
- Utiliza EMA para determinar el giro de la tendencia, no es sensible a las fluctuaciones de menor alcance
- El filtro del RSI evita la inversión de señales falsas
- Se pueden personalizar los ciclos EMA y los parámetros RSI para adaptarse a diferentes mercados
- El código es intuitivo, sencillo y fácil de entender.
Análisis de riesgos
- La EMA está rezagada y puede haber perdido el punto de inflexión
- El fallo de la EMA en medio de un mercado convulsionado
- Los parámetros EMA y RSI deben ajustarse adecuadamente
- Se puede combinar con otras señales de verificación de indicadores
Dirección de optimización
- La determinación de la señal de verificación en combinación con otros indicadores
- Aumentar el riesgo de las estrategias de control de pérdidas
- Prueba de la estabilidad de los diferentes parámetros de ciclo
- Aumentar el índice de fortaleza monetaria para evitar el riesgo monetario
- Tener en cuenta el coste de transacción y la rentabilidad
Resumir
La estrategia tiene una idea general clara, utiliza EMA para juzgar el giro de la tendencia, en combinación con las señales de filtración del indicador RSI, para capturar eficazmente la tendencia de la línea media larga. Sin embargo, la estrategia de ajuste y deterioro de los parámetros de EMA y RSI aún necesita ser optimizada, y se enfrenta al riesgo de perder el punto de inflexión y el mercado de la oscilación. Si la optimización de los parámetros y el control del riesgo están en su lugar, la estrategia puede usarse para descubrir el punto de inflexión de la tendencia de la línea media larga y tomar decisiones de inversión.
/*backtest
start: 2022-12-18 00:00:00
end: 2023-12-24 00:00:00
period: 1d
basePeriod: 1h
exchanges: [{"eid":"Futures_Binance","currency":"BTC_USDT"}]
*/

//@version=5
strategy("Trend Change with EMA Entry/Exit - Intraday", overlay=true)

// Define the fast and slow EMA periods
fast_ema_period = input(10, title="Fast EMA Period")
slow_ema_period = input(50, title="Slow EMA Period")

// Calculate the EMAs
ema_fast = ta.ema(close, fast_ema_period)
ema_slow = ta.ema(close, slow_ema_period)

// Plot the EMAs on the chart
plot(ema_fast, title="Fast EMA", color=color.blue, linewidth=2)
plot(ema_slow, title="Slow EMA", color=color.orange, linewidth=2)

// Detect trend changes (crossovers and crossunders)
is_uptrend = ta.crossover(ema_fast, ema_slow)
is_downtrend = ta.crossunder(ema_fast, ema_slow)

// Relative Strength Index (RSI)
rsi_length = input(14, title="RSI Length")
overbought_level = input(70, title="Overbought Level")
oversold_level = input(30, title="Oversold Level")
rsi_value = ta.rsi(close, rsi_length)

// Trend Filter
is_trending = ta.change(is_uptrend) != 0 or ta.change(is_downtrend) != 0

// Entry and Exit signals
enter_long = is_uptrend and rsi_value < overbought_level and is_trending
exit_long = is_downtrend and is_trending
enter_short = is_downtrend and rsi_value > oversold_level and is_trending
exit_short = is_uptrend and is_trending

strategy.entry("Buy", strategy.long, when=enter_long)
strategy.close("Buy", when=exit_long)
strategy.entry("Sell", strategy.short, when=enter_short)
strategy.close("Sell", when=exit_short)