Estrategia de seguimiento de tendencias de Bohr Steel
Descripción general
La estrategia se basa en el análisis de las bandas de Bol, las medias móviles y el volumen de transacciones para lograr una estrategia de seguimiento de tendencias sólida. La estrategia tiene como objetivo capturar posibles reveses de tendencias y aprovechar la dinámica del mercado.
Principio de estrategia
Cintas de acero de Bohr
Utiliza la banda de acero de Bol para identificar el estado de sobrecompra y sobreventa en el mercado. Ayuda a la toma de decisiones a través de una clara visualización de la subida y bajada de las vías.
El principio básico de la cinta de acero de Bol es calcular la subida y bajada de la racha en función del valor medio y la diferencia estándar del precio de las acciones en un período determinado. La subida y bajada de la racha en el precio de las acciones es una señal de sobrecompra, y la bajada y bajada de la racha es una señal de sobreventa.
Filtros de media móvil
Implementa un filtro de media móvil para mejorar la identificación de tendencias. El usuario puede elegir entre diferentes tipos de media móvil, como media móvil simple, media móvil indexada y media móvil ponderada.
Cuando el precio sube a través de la media móvil, se genera una señal de compra (venta).
Análisis de las entregas
Permite a los usuarios integrar el análisis de la transacción en la estrategia para la confirmación de la señal. Las columnas de cantidad de diferentes colores indican que la transacción es superior o inferior a la media.
El volumen de transacciones que supera el promedio puede utilizarse para confirmar la señal de precio.
Análisis de las ventajas
Una estrategia de seguimiento de tendencias sólida
La inversión de la tendencia del mercado basada en las bandas de acero de Bol, las medias móviles y el volumen de transacción.
La capacidad de capturar las tendencias de los precios en tiempo real y seguirlas para obtener beneficios.
Flexibilidad y personalización
El usuario puede elegir los parámetros de la banda de Bol, el tipo de media móvil y la longitud para optimizar.
Las posiciones de largo plazo y las de vacío se pueden controlar por separado.
Visualización y confirmación
Un mecanismo de doble señal que confirma la señal de precio de la banda de acero de Bol a través de la media móvil y el volumen de transacción.
Muestra las señales de trading, como las medias móviles, las líneas de stop loss, etc.
Gestión de riesgos
Se puede personalizar el ciclo de ATR y el multiplicador de ATR.
Ajuste el tamaño de la posición según el porcentaje de riesgo de la posición. Controlar eficazmente las pérdidas individuales.
Análisis de riesgos
Riesgo del ciclo de retroalimentación
- Diferentes ciclos históricos pueden tener un impacto en el rendimiento de la estrategia. Se debe hacer un retraso en diferentes ciclos para asegurar la solidez de la estrategia.
Riesgo de inversión de tendencia
- El riesgo de que se produzca un estancamiento frecuente en situaciones de volatilidad puede reducirse optimizando los parámetros de las medias móviles.
Riesgo de la optimización excesiva
- La optimización de múltiples parámetros puede conducir a una optimización excesiva, por lo que se debe utilizar una combinación de múltiples parámetros y realizar pruebas de robustez.
Riesgo de retraso en los indicadores técnicos
- El cálculo de los indicadores tiene ciertos retrasos, y no se puede confiar completamente en los indicadores, que deben combinarse con el criterio de las entidades de precios.
Dirección de optimización
Optimización de parámetros
- Optimización de los parámetros de la banda de Bol, los tipos de medias móviles y los parámetros ATR para adaptarse a diferentes variedades y períodos.
Optimización de posiciones
- Prueba de diferentes niveles de porcentaje de riesgo de la posición para optimizar el multiplicador de pérdidas.
Optimización de señal
- La prueba se añade a otras señales auxiliares de filtración de indicadores, como KD, MACD, etc.
Optimización del código
- Optimización de la lógica de juicio de señales, reducción de la necesidad de abrir posiciones. La adopción de programación orientada a objetos mejora la escalabilidad.
Resumir
La estrategia integra bandas de acero de Bohr, promedios móviles y análisis de volumen de transacciones para construir un sistema de comercio mecánico que sigue la tendencia. La estrategia tiene la ventaja de que el mecanismo de confirmación de señales es fuerte y el riesgo está controlado.
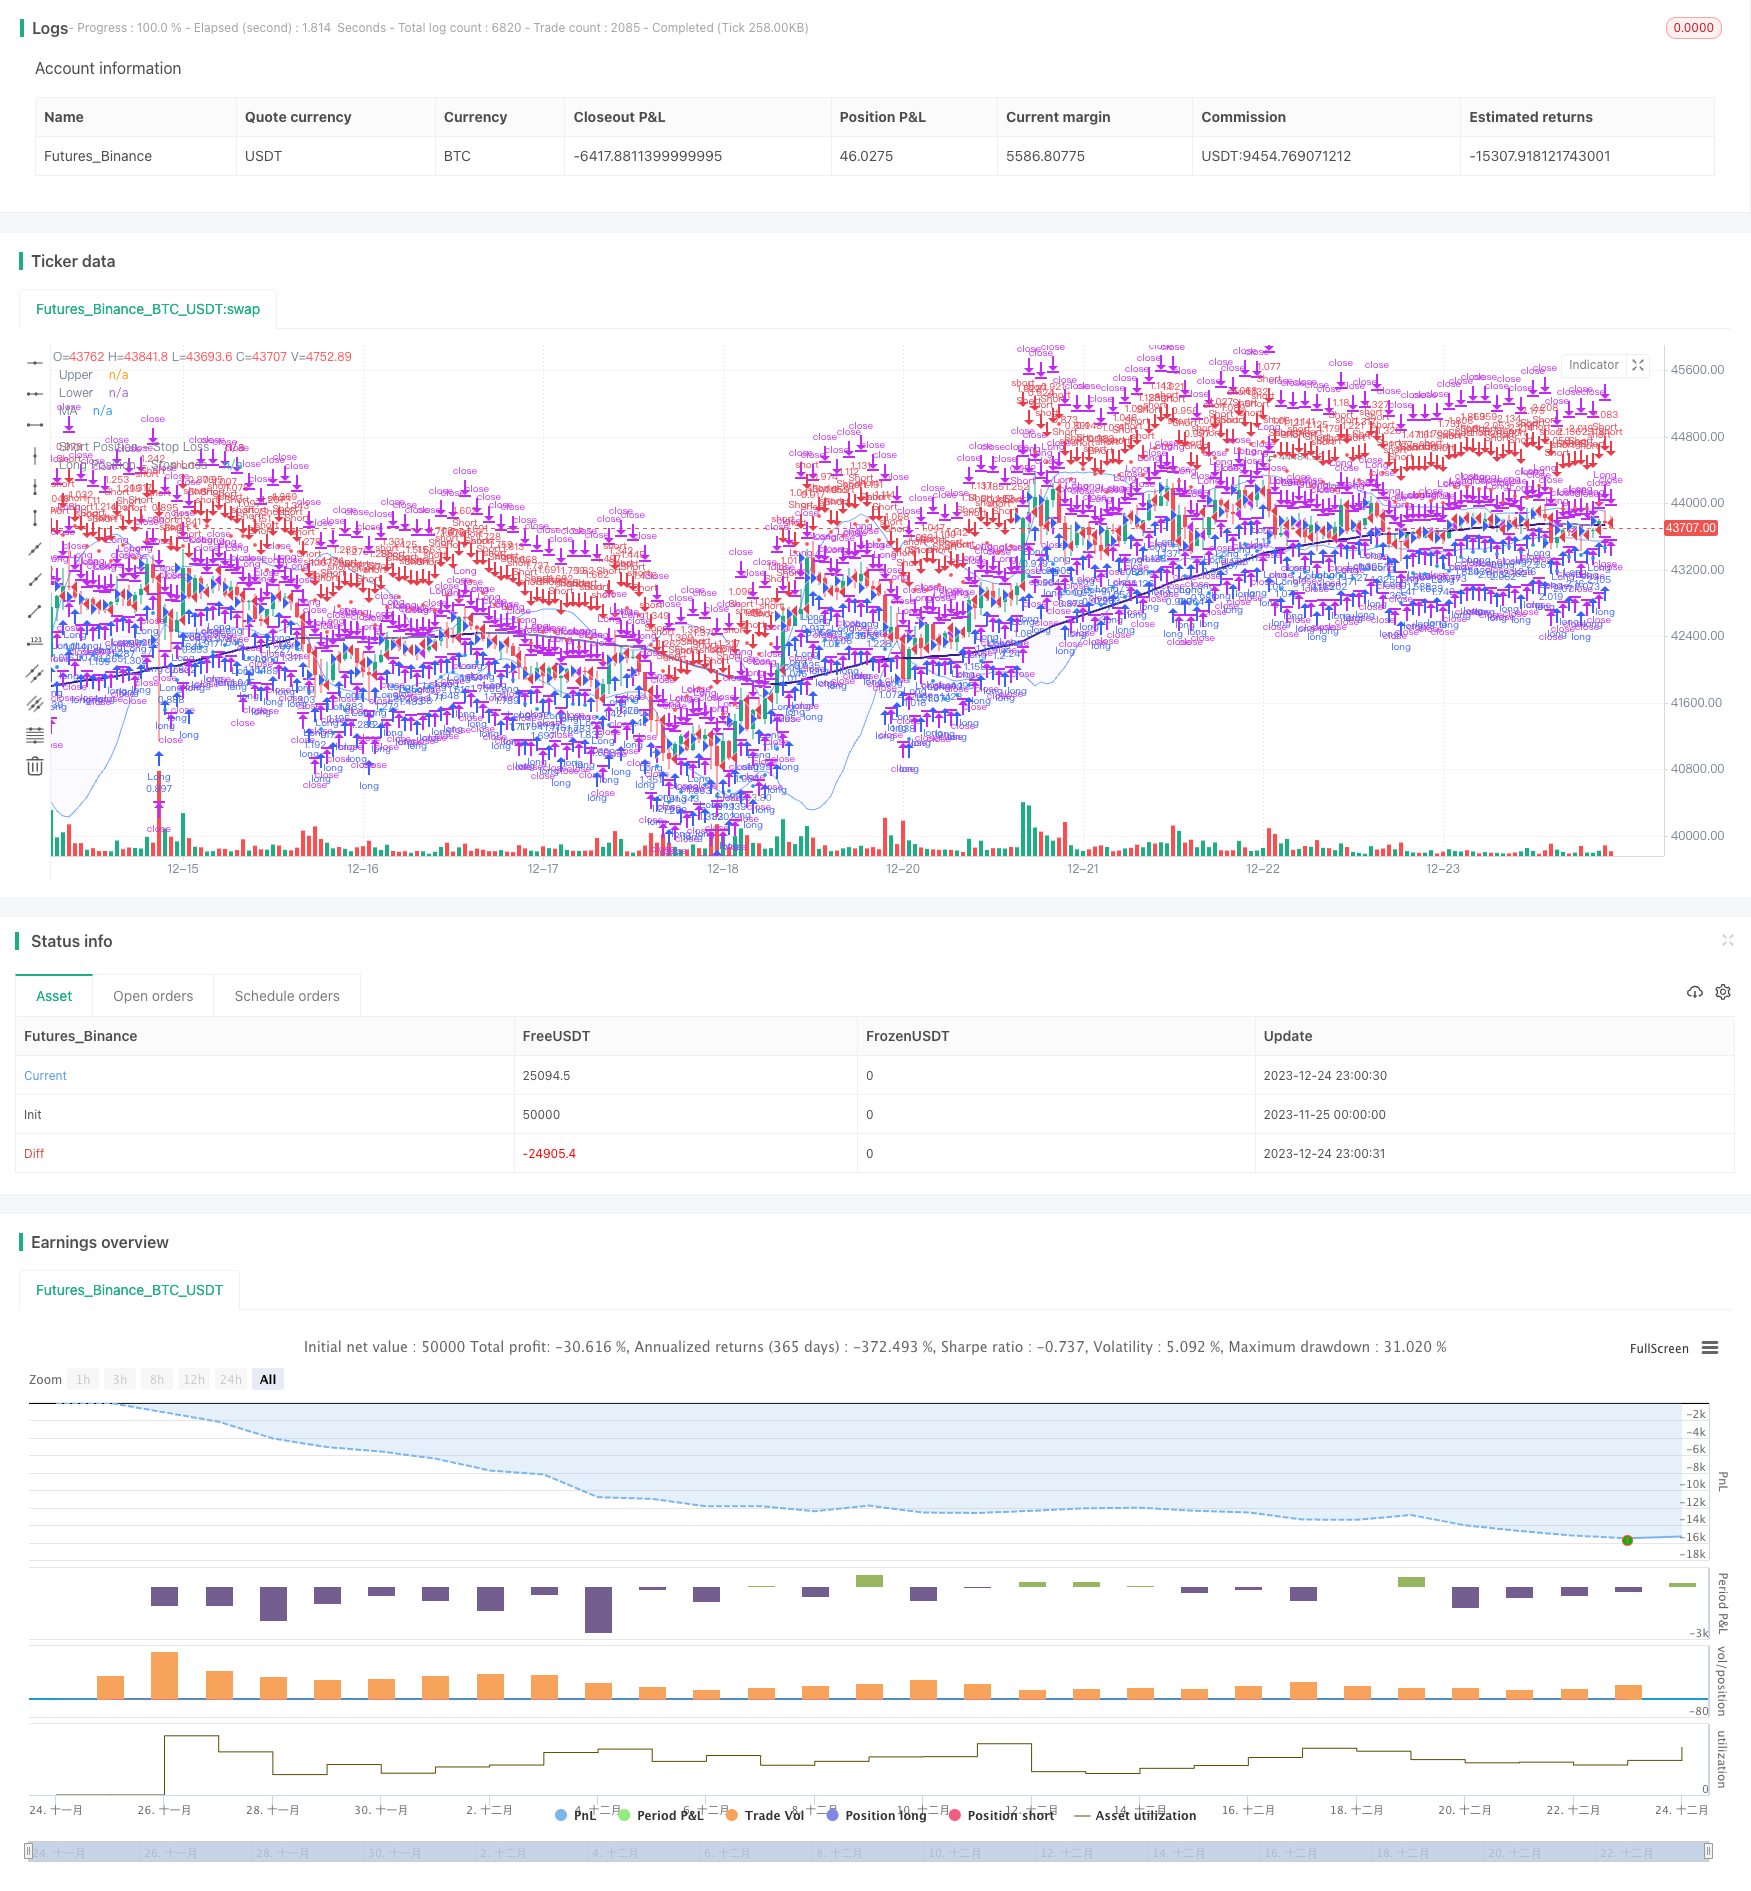
/*backtest
start: 2023-11-25 00:00:00
end: 2023-12-25 00:00:00
period: 1h
basePeriod: 15m
exchanges: [{"eid":"Futures_Binance","currency":"BTC_USDT"}]
*/

// This source code is subject to the terms of the Mozilla Public License 2.0 at https://mozilla.org/MPL/2.0/
// © sosacur01

//@version=5
strategy(title="Bollinger Band | Trend Following", overlay=true, pyramiding=1, commission_type=strategy.commission.percent, commission_value=0.2, initial_capital=10000)

//--------------------------------------

//BACKTEST RANGE
useDateFilter = input.bool(true, title="Filter Date Range of Backtest",
     group="Backtest Time Period")
backtestStartDate = input(timestamp("1 jan 2017"),
     title="Start Date", group="Backtest Time Period",
     tooltip="This start date is in the time zone of the exchange " +
     "where the chart's instrument trades. It doesn't use the time " +
     "zone of the chart or of your computer.")
backtestEndDate = input(timestamp("1 jul 2100"),
     title="End Date", group="Backtest Time Period",
     tooltip="This end date is in the time zone of the exchange " +
     "where the chart's instrument trades. It doesn't use the time " +
     "zone of the chart or of your computer.")
inTradeWindow = true
if not inTradeWindow and inTradeWindow[1]
    strategy.cancel_all()
    strategy.close_all(comment="Date Range Exit")

//--------------------------------------

//LONG/SHORT POSITION ON/OFF INPUT
LongPositions   = input.bool(title='On/Off Long Postion', defval=true, group="Long & Short Position")
ShortPositions  = input.bool(title='On/Off Short Postion', defval=true, group="Long & Short Position")

//--------------------------------------
//MA INPUTS
averageType1    = input.string(defval="WMA", group="MA", title="MA Type", options=["SMA", "EMA", "WMA", "HMA", "RMA", "SWMA", "ALMA", "VWMA", "VWAP"])
averageLength1  = input.int(defval=99, title="MA Lenght", group="MA")
averageSource1  = input(close, title="MA Source", group="MA")

//MA TYPE
MovAvgType1(averageType1, averageSource1, averageLength1) =>
	switch str.upper(averageType1)
        "SMA"  => ta.sma(averageSource1, averageLength1)
        "EMA"  => ta.ema(averageSource1, averageLength1)
        "WMA"  => ta.wma(averageSource1, averageLength1)
        "HMA"  => ta.hma(averageSource1, averageLength1)
        "RMA"  => ta.rma(averageSource1, averageLength1)
        "SWMA" => ta.swma(averageSource1)
        "ALMA" => ta.alma(averageSource1, averageLength1, 0.85, 6)
        "VWMA" => ta.vwma(averageSource1, averageLength1)
        "VWAP" => ta.vwap(averageSource1)
        => runtime.error("Moving average type '" + averageType1 +
             "' not found!"), na


//MA VALUES
ma  = MovAvgType1(averageType1, averageSource1, averageLength1)

//MA CONDITIONS
bullish_ma = close > ma
bearish_ma = close < ma

//PLOT COLOR
ma_plot    = if close > ma
    color.navy
else
    color.rgb(49, 27, 146, 40)

//MA PLOT
plot(ma,color=ma_plot, linewidth=2, title="MA")

//--------------------------------------
//BB INPUTS
length  = input.int(20, minval=1, group="BB")
src     = input(close, title="Source", group="BB")
mult    = input.float(2.0, minval=0.001, maxval=50, title="StdDev", group="BB")

//BB VALUES
basis = ta.sma(src, length)
dev = mult * ta.stdev(src, length)
upper = basis + dev
lower = basis - dev
offset = input.int(0, "Offset", minval = -500, maxval = 500)

//BBPLOT
//plot(basis, "Basis", color=#FF6D00, offset = offset)
p1 = plot(upper, "Upper", color=#2978ffa4, offset = offset)
p2 = plot(lower, "Lower", color=#2978ffa4, offset = offset)
fill(p1, p2, title = "Background", color=color.rgb(33, 47, 243, 97))

//BB ENTRY AND EXIT CONDITIONS
bb_long_entry  = close >= upper
bb_long_exit   = close <= lower
bb_short_entry = close <= lower
bb_short_exit  = close >= upper

//---------------------------------------------------------------
//VOLUME INPUTS
useVolumefilter  = input.bool(title='Use Volume Filter?', defval=false, group="Volume Inputs")
dailyLength      = input.int(title = "MA length", defval = 30, minval = 1, maxval = 100, group = "Volume Inputs")
lineWidth        = input.int(title = "Width of volume bars", defval = 3, minval = 1, maxval = 6, group = "Volume Inputs")
Volumefilter_display  = input.bool(title="Color bars?", defval=false, group="Volume Inputs", tooltip = "Change bar colors when Volume is above average")

//VOLUME VALUES
volumeAvgDaily = ta.sma(volume, dailyLength)

//VOLUME SIGNAL
v_trigger  = (useVolumefilter ? volume > volumeAvgDaily : inTradeWindow)

//PLOT VOLUME SIGNAL
barcolor(Volumefilter_display ? v_trigger ? color.new(#6fe477, 77):na: na, title="Volume Filter")
//---------------------------------------------------------------

//ENTRIES AND EXITS
long_entry  = if inTradeWindow and bullish_ma and bb_long_entry and v_trigger and LongPositions
    true
long_exit   = if inTradeWindow and bb_long_exit
    true

short_entry = if inTradeWindow  and bearish_ma and bb_short_entry and v_trigger and ShortPositions
    true
short_exit  = if inTradeWindow  and bb_short_exit
    true

//--------------------------------------

//RISK MANAGEMENT - SL, MONEY AT RISK, POSITION SIZING
atrPeriod                = input.int(14, "ATR Length", group="Risk Management Inputs")
sl_atr_multiplier        = input.float(title="Long Position - Stop Loss - ATR Multiplier", defval=2, group="Risk Management Inputs", step=0.5)
sl_atr_multiplier_short  = input.float(title="Short Position - Stop Loss - ATR Multiplier", defval=2, group="Risk Management Inputs", step=0.5)
i_pctStop                = input.float(2, title="% of Equity at Risk", step=.5, group="Risk Management Inputs")/100

//ATR VALUE
_atr = ta.atr(atrPeriod)

//CALCULATE LAST ENTRY PRICE
lastEntryPrice = strategy.opentrades.entry_price(strategy.opentrades - 1)

//STOP LOSS - LONG POSITIONS
var float sl = na

//CALCULTE SL WITH ATR AT ENTRY PRICE - LONG POSITION
if (strategy.position_size[1] != strategy.position_size)
    sl := lastEntryPrice - (_atr * sl_atr_multiplier)

//IN TRADE - LONG POSITIONS
inTrade = strategy.position_size > 0

//PLOT SL - LONG POSITIONS
plot(inTrade ? sl : na, color=color.blue, style=plot.style_circles, title="Long Position - Stop Loss")

//CALCULATE ORDER SIZE - LONG POSITIONS
positionSize = (strategy.equity * i_pctStop) / (_atr * sl_atr_multiplier)

//============================================================================================

//STOP LOSS - SHORT POSITIONS
var float sl_short = na

//CALCULTE SL WITH ATR AT ENTRY PRICE - SHORT POSITIONS
if (strategy.position_size[1] != strategy.position_size)
    sl_short := lastEntryPrice + (_atr * sl_atr_multiplier_short)

//IN TRADE SHORT POSITIONS
inTrade_short = strategy.position_size < 0

//PLOT SL - SHORT POSITIONS
plot(inTrade_short ? sl_short : na, color=color.red, style=plot.style_circles, title="Short Position - Stop Loss")

//CALCULATE ORDER - SHORT POSITIONS
positionSize_short = (strategy.equity * i_pctStop) / (_atr * sl_atr_multiplier_short)


//===============================================

//LONG STRATEGY
strategy.entry("Long", strategy.long, comment="Long", when = long_entry, qty=positionSize)
if (strategy.position_size > 0)
    strategy.close("Long", when = (long_exit), comment="Close Long")
    strategy.exit("Long", stop = sl, comment="Exit Long")

//SHORT STRATEGY
strategy.entry("Short", strategy.short, comment="Short", when = short_entry, qty=positionSize_short)
if (strategy.position_size < 0)
    strategy.close("Short", when = (short_exit), comment="Close Short")
    strategy.exit("Short", stop = sl_short, comment="Exit Short")

//ONE DIRECTION TRADING COMMAND (BELLOW ONLY ACTIVATE TO CORRECT BUGS)
//strategy.risk.allow_entry_in(strategy.direction.long)